Although all the statistical analyses described on this website can be done with standard Excel capabilities, it is often easier to use the supplemental functions and data analysis tools provided in the Real Statistics Resource Pack.
The functions provided in the Real Statistics Resource Pack are summarized in Real Statistics Functions. Here we briefly review the available supplemental data analysis tools.
Accessing Real Statistics Data Analysis Tools
You can access the Real Statistics data analysis tools by pressing Ctrl-m or via the Add-Ins ribbon (as described in Accessing Real Statistics Tools). One of two dialog boxes will appear which lists all the available supplemental data analysis tools (see Figures 1 and 2).
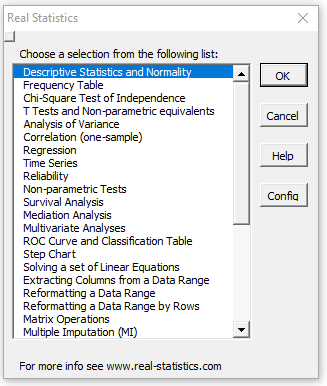
Figure 1 – Original Real Statistics data analysis tools main menu
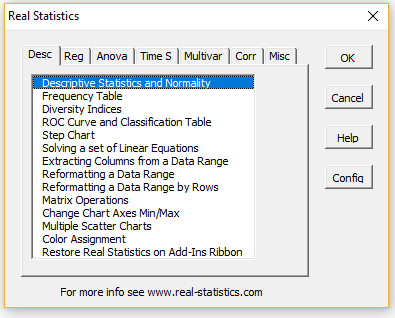
Figure 2 – Real Statistics multipage data analysis tools main menu
You next choose one of the data analysis tools from this list. A dialog box will now appear which is similar to that presented in Figure 2 of Excel’s Data Analysis Tools, as described in detail in Using Real Statistics Data Analysis Tools.
The following are the currently supported Real Statistics data analysis tools.
List of Real Statistics Data Analysis Tools
You can click on any of the data analysis tools listed below (or the listed options within these tools) to get additional information about that tool (or option). The data analysis tools are listed in the tab order of the multipage interface.
Descriptive Statistics Tab
Descriptive Statistics and Normality: includes:
- Descriptive Statistics
- Box Plot
- Box Plot with Outliers
- Dot Plot
- QQ Plot
- Shapiro Wilks
- Outliers and Missing Data
- Grubbs’ Test
Frequency Table Descriptive Statistics
- Create raw data from frequency table
- Descriptive statistics for frequency table
- Kolmogorov-Smirnov test
Histogram with Normal Curve Overlay
- Create a frequency table and histogram
- Create a frequency table and histogram based on bins
- Create a histogram with normal curve overlay
Kernel Density Estimation
Diversity Indices
Homogeneity of Variances
- Data Analysis Tool
- Levene’s Test
- O’Brien’s Test
- Fligner Killeen Test
- Bartlett’s Test
- Conover Squared Ranks Test
- F-test
- Siegel-Tukey Test
ROC Curve and Classification Table
Step Chart
Extract Columns from Data Range – allows you to create a new data range by selecting certain columns from an existing data range
Reformatting a Data Range
- Reformat Data Range, includes:
- Reshape – reproduce input data in a range of a different shape
- Reverse – reverse the order of the input data range
- Sort – reproduce the data in ascending sorted order
- Sort without duplicates – reproduce the data in sorted order removing duplicates
- Shuffle – randomly permute the data (selection without replacement)
- Randomize – randomly select data from a data range (with replacement)
- Remove blank cells – remove all empty cells
- Remove non-numeric cells – remove all cells with non-numeric data
- Remove error cells – replace any error cells with empty cells
- Copy exact formulas – copy a range to a new location without changing the cell addresses
Reformatting a Data Range by Rows
- Sort by rows – sort rows based on the value of the cell in a selected column
- Remove rows with empty cell(s) – remove any row with an empty cell
- Remove rows with non-num cell(s) – remove any row with a non-numeric cell
Matrix Operations
- Matrix Operations, includes:
- Transpose – transposes a matrix
- Correlation Matrix – creates the correlation matrix for the specified data range
- Covariance Matrix – creates the population or sample covariance matrix for the specified data range
- Inverse – inverts a square matrix
- Diagonal – creates a diagonal matrix with specified diagonal
- Eigenvalues and Eigenvectors – finds the eigenvalues and eigenvectors of a symmetric square input matrix
- QR Factorization – finds an orthogonal matrix Q and upper triangular R where the input matrix = QR
- Schur Factorization – finds an orthogonal matrix Q and upper triangular T such that the input matrix = QTQT.
- SVD Factorization – finds the Singular Value Decomposition (SVD) consisting of diagonal matrix D and orthogonal matrices U and V where input matrix = UDVT.
- Spectral Factorization – finds the Spectral Decomposition of a symmetric input matrix which is equal to QDQT where D is a diagonal matrix and Q is an orthogonal matrix
- LU Factorization – finds the LUP Decomposition of a square input matrix, which is equal to PTLU where P is a permutation matrix, L is a lower triangular matrix and U is an upper triangular matrix
- Hessenberg Factorization– finds the Hessenberg Decomposition of a square matrix, which is equal to QTHQ where Q is an orthogonal matrix and H is a Hessenberg matrix.
- Identity Matrix – creates an identity matrix of the specified size
- Empty Box – creates an empty matrix of the specified size and shape
Change Chart Axes Bounds
Multiple Scatter Charts
Color Assignment
Restore Real Statistics on Add-ins Ribbon
Regression Tab
Regression, includes
Multiple Linear Regression, includes
- Regression Analysis – performs multiple linear regression analysis
- Regression without a Constant – assumes the intercept is zero
- Robust Standard Errors – select none or type HC0 through HC3
- Residuals and Cook’s D – create a table that includes Cook’s Distance and DFFITS, for use in identifying outliers and influencers in regression
- Durbin-Watson Test – checks for autocorrelation
- Heteroskedasticity Test – Breusch-Pagan and White tests
- Normality Test – tests normality of residuals
- Stepwise Regression
- Regression using Solver
Other types of Regression
- Weighted Linear Regression – esp. useful to address heteroscedasticity
- Least Absolute Deviation (LAD) Regression
- Lp Regression
- Deming Regression
- Passing-Bablok Regression
- Exponential Regression – nonlinear version
- Polynomial Regression
- Poisson Regression
- Mediation Analysis
- Moderation Analysis
Autocorrelation
Logistic and Probit Regression
- Logistic Regression using Solver
- Logistic Regression using Newton’s Method
- Classification Table
- ROC Curve
- Probit Regression
- Concise Logistic and Probit Regression Tool
Multinomial Logistic Regression
- Multinomial Logistic Regression (for raw and summary data)
Confidence and Prediction Interval Plots
ANOVA Tab
Single Factor Anova, supports Excel and standard formats and includes:
- Anova: Single Factor
- Kruskal-Wallis non-parametric test
- Brown-Forsythe F* test
- Welch’s test
- Levene’s Test for homogeneity of variances
- Anova follow-up tests
- Kruskal-Wallis follow-up tests
- Random Factor
Two Factor Anova, supports Excel and standard formats and includes:
- Anova model, used for balanced models
- Regression model, used for unbalanced models
- Descriptive statistics, including interaction tables
- Two Random Factors
- Two Mixed Factors
- Reformat Data (convert data into one-way Anova format)
- Scheirer-Ray-Hare Test
- Aligned Rank Transform (ART) ANOVA
- Gage R&R
Three Factor Anova, supports standard formats by row and by column and includes:
- Anova model, used for balanced models
- Regression model, used for unbalanced models
- Descriptive statistics
- Regression without replication
One Factor Repeated Measures Anova, includes
- Anova: Repeated Measures (one within-subjects factor)
- Model using Regression
- Contrasts
- Tukey HSD
- Pairwise paired sample t-tests
Two Factor Repeated Measures Anova
Two Mixed Repeated Measures Anova, includes
- Anova: Repeated Measures (one within-subjects and one between-subjects factor)
- Model using Regression
Three Mixed Repeated Measures Anova, includes
- One within-subjects and two between-subjects factors
- One between-subjects and two within-subjects factors
Nested Anova
Randomized Complete Block Design, supports Excel and standard formats and includes:
- Anova: RCBD
- Contrasts for RCBD
- Tukey’s HSD for RCBD
- RCBD with one missing data element
- RCBD using regression
Split-plot Design, supports Excel and standard formats and includes:
- Anova: Split-plot Design (RCBD whole plots version)
- Anova: Split-plot Design (CRD whole plots version)
- Contrasts for Split-plot Design
- Tukey’s HSD for Split-plot Design
Latin Squares Design, supports Excel and standard formats and includes:
2^k Factorial Design, supports Excel and standard formats and includes:
Two Factor Anova with Replications Follow-up
- Simple Effect (rows, columns)
- Contrasts (rows, columns, interaction)
- Tukey HSD (rows, columns, interaction)
Two Factor Anova without Replications Follow-up
Anova Follow-up (esp. used after Three Factor ANOVA)
Analysis of Covariance (Ancova)
Friedman Test
- Friedman Test
- Post-hoc tests (Nemenyi, Conover, Pairwise Signed-Rank)
Time Series Tab
Basic Time Series Forecasting
- Basic Time Series Forecasting, includes
- Simple Moving Average
- Weighted Moving Average
- Simple Exponential Smoothing
- Holt’s Linear Trend
- Holt’s Linear Trend with Damping
- Holt-Winters (multiplicative and additive)
ARIMA Modelling and Forecasting
SARIMA Modelling and Forecasting
Time Series Testing
- Time Series Testing Tool, includes
- ACF and ACVF
- PACF
- Bartlett’s, Box-Pierce, Ljung-Box tests
- ADF test
- Augmented ADF test
Forecast Accuracy
- The Forecast Accuracy Tool, includes
- Forecast Error Statistics
- Diebold-Mariano and HLN Test
- Pesaran-Timmermann Test
Correlogram
Cointegration
Cross Correlations
- Fixed-effects model using differencing
- Fixed-effects model using demeaning
- Fixed-effects model using dummy variables
- Random-effects model
Multivariate Analysis Tab
Hotelling’s T-square Test
- Example of data analysis tool
- One sample
- Two paired samples
- Two independent samples with equal covariance matrices
- Two independent samples with unequal covariance matrices
- Repeated Measures – using one sample T-square test for one factor repeated measures analyses
Single Factor MANOVA
- Single Factor MANOVA, includes:
- Significance Testing – significant test for MANOVA omnibus test
- Sum of Squares and Cross Product (SSCP) Matrices – displays T, H, and E matrices
- Group and Total Means – displays group and total mean vectors
- Group Covariance Matrices – displays group covariance matrices
- Multivariate Outliers – test for outliers using Mahalanobis distance
- Box’s Test – test for homogeneity of covariance matrices
- Multiple ANOVA – follow up MANOVA with ANOVA on all dependent variables
- Contrasts – follow up MANOVA with multivariate and univariate contrasts
- Repeated Measures – using MANOVA for two-factor repeated measures analyses
Two Factor MANOVA
- Two Factor MANOVA (including output similar to that for One Factor MANOVA)
Multivariate Repeated Measures Analysis
- Repeated Measures Analysis (1W+0B) – using a one-sample T-square test
- Repeated Measures Analysis (1W+1B) – using one-factor MANOVA
- Repeated Measures Analysis (2W+0B) – using a one-sample T-square test
- Repeated Measures Analysis (2W+1B) – using one-factor MANOVA
Factor Analysis – includes correlation matrix, eigenvalues/vectors, factor matrix, Varimax rotation, factor scores
Cluster Analysis
- Cluster Analysis – k-means++ test
- Jenks Natural Breaks
Discriminant Analysis
Correspondence Analysis
Confidence Ellipse
Permutational MANOVA
Correlation, Reliability, and Missing Data Tab
Correlation (one-sample), includes
Association Tests
- Lambda asymmetric measure of association
- Gamma symmetric measure of association
- Somers’ d asymmetric measure of association
Internal Consistency Reliability
Interrater Reliability
- Cohen’s kappa
- Cohen’s weighted kappa
- Fleiss’s kappa
- Intraclass correlation
- Kendall’s W (with or without correction for ties)
- Krippendorff’s Alpha
- Gwet’s AC2
- Bland-Altman
Item Analysis
- Item analysis (item difficulty, item discrimination, and point-serial correlation)
Rasch Item Response Analysis
- Rasch analysis (UCON dichotomous model)
- Rasch analysis (UCON polytomous model)
- Rasch analysis (PROX model)
- Eliminate zero or perfect scores
Polychoric Correlation
- Polychoric Correlation (including tetrachoric correlation)
Multiple Imputation (MI)
- Frequency and patterns of missing data
- Simple imputation
- FCS imputation
- Combining multiple imputations
- Multiple regression using MI
Full Information Maximum Likelihood (FIML)
- Pairwise frequency of missing data
- FIML using Solver
- Multiple regression using FIML
- Data analysis tool
Estimation-Maximization (EM)
Neural Networks
- Neural Networks includes:
- Training
- Testing
Coding an Image
Miscellaneous Tab
T Tests and Non-parametric equivalents
- T Test: One Sample
- T Test: Two Independent Samples
- T Test: Two Paired Samples
- Mann-Whitney Test for Independent Samples
- Wilcoxon Signed-Rank Test for Paired Samples
- Wilcoxon Signed-Rank Test for One Sample
Non-parametric Tests
- Non-parametric Tests; includes
- Sign Test
- Cochran’s Q Test (raw data and summary data options; includes McNemar’s Test)
- One Sample Runs Test
- Two Sample Runs Test
- Moods’ Median Test
- Jonckheere-Terpstre Test
- Mann-Whitney Test
- Wilcoxon Signed-Ranks Test
- Kruskal-Wallis Test
Chi-square Test for Independence – tests m × n contingency tables for independence, data can alternatively be in standard (stacked) format
- Chi-Square Test for Independence
- Ordered Chi-square Test for Independence
- Nominal-Ordinal Chi-square Test
- Fisher’s Exact Test
- Quasi-Exact Test (simulation)
- Independence testing with missing data
Cochran-Mantel-Haenszel Test
Goodness of Fit Testing
- Goodness of Fit Analysis, includes
- One-Sample Kolmogorov-Smirnov Test
- Two Sample Kolmogorov-Smirnov Test (raw data and frequency table options)
- One-Sample Anderson-Darling Test
- Two-Sample Anderson-Darling Test (raw and frequency table options)
- Chi-square Goodness of Fit Test
Distribution Fitting
- Distribution Fitting, includes
- Weibull: method of moments, MLE, regression
- Weibull with censored data
- Gumbel: method of moments, MLE
- Logistic: method of moments, MLE
- Laplace: method of moments, MLE
- Pareto: method of moments, MLE
- Gamma: method of moments, MLE
- Beta: method of moments, MLE
- Uniform: method of moments, MLE
- Normal
- Lognormal: method of moments, MLE
- Exponential: method of moments, MLE
- Geometric: method of moments, MLE
Resampling
- Bootstrapping (p-values, histograms, and confidence intervals) for one sample, two samples, paired sample, multiple group (ANOVA), and correlation coefficient tests
- Randomization (p-values and histograms) for two samples, paired sample, multiple groups (ANOVA), and correlation coefficient tests
Proportion Tests
Multiple Tests
- Multiple Tests; includes:
- Conservative Tests (Bonferroni and Dunn-Sidàk)
- Holm’s and Hochberg’s Tests
- Benjamini-Hochberg and Benjamini-Yekutieli Tests
Solve Set of Linear Equations; includes:
- Solve Set of Linear Equations – outputs the solution only
- Perform Gaussian Elimination – shows the result of Gaussian elimination
Spline Curve Fit
Bayesian Tools
Survival Analysis, includes
Network Diagram
Statistical Power and Sample Size Requirements
This data analysis tool supports the following tests:
- One-sample normal test
- Two-sample normal test
- One-sample and paired-sample t-test
- Two-sample t-test
- One-sample binomial test
- One-sample correlation test
- One-sample variance test
- Two-sample variance test
- Chi-square test (goodness of fit and independence tests)
- One-way ANOVA
- Multiple regression
- Logistic regression (normally and binomially distributed independent variables)
- Cronbach’s alpha test
- Intraclass correlation
- Cohen’s kappa
Dear Charles,
I’ve tried to calculate the ADC in accordance with 8.3.2.2(j) of CMH-17-1G, but its result is unexpected. Do you have a solution? thanks.
Hello Lutfi,
I am not familiar with the abbreviations ADC and 8.3.2.2(j) of CMH-17-1G. What do they mean?
Charles
Can you please tell me where can I find the prime number functions particularly IsPrime(n)? Thanks
Hi Keith,
IsPrime(n) is a worksheet function. Once you have downloaded and installed the free Real Statistics Resource Pack you can use IsPrime just like any Excel worksheet function.
For a list of Real Statistics’ prime number features, see
https://www.real-statistics.com/other-mathematical-topics/prime-numbers/
For information about how to download and install Real Statistics, see
https://www.real-statistics.com/free-download/real-statistics-resource-pack/
Charles
Charles
ItWorks! Thanks Charles.
Keith,
Good to hear. Congratulations!
Charles
May I ask where can I find the z test two sample for means in your add-in in excel?
It would be wonderful if I can receive a reply due to my upcoming research. Thank you very much!
Sir
Which imputation method can be used for univariate not normally distributed missing rainfall times series
See https://www.real-statistics.com/time-series-analysis/stochastic-processes/handling-missing-time-series-data/
Charles
Hi
Is there a way to use real statistics to calculate the minimum required sample size for a study to determine the sensitivity and specificity of a diagnostic tool?
Naveed,
What approach or tool are you using to determine sensitivity and specificity?
Charles
Please add training test split
Can you please describe in more detail what you want me to add?
Charles
I guess he wants you to add functionality for splitting the data into Training Set and Testing Set to make it work like Data Analytics tools used for forecasting.
Supposing that your sample size is n and you want to use 10% of the data for testing. You just need to randomly select 10% of the data to be in the testing set and the rest will be placed in the training set. One way to accomplish this is to add a sequence number from 1 to n to each row in the data set. You can then use the Real Statistics SHUFFLES function to shuffle the values 1 to n. The first 10% of the resulting rows would be used for testing and the others would be used for training.
I will look into adding this capability to Real Statistics.
Charles
Dear Professor,
First of all thanks for this great add-in.
How can I work with a base where data needs to be weighted first? because of a complex sample? I know how to do the statistic but I have not yet find an option “weight by”. Thanks!
Hello,
Can you give me an example of how the “weight by” would work?
Charles
Like the program abilities but after 1st installation the program shows up on addins but does not run.
Tried all the methods listed but have to unintall and reinstall to get it to work.
Also shows password when using macro method.
Is there a way to stop the program not working or reinstalling every time I get out of excel.
Joe,
Does it run when you use the Ctrl-m key sequence?
Charles
I’m trying to access SlopesTest in Excel 2007. I’ve successfully installed Real Statistics but can’t find SlopesTest. How can I access it?
Randy,
It is not a data analysis tool. You can access it via the SlopesTest function. See
https://real-statistics.com/regression/hypothesis-testing-significance-regression-line-slope/comparing-slopes-two-independent-samples/
Charles
Hi
I had a problem with the functions such as QSORT not being recognised with the #NAME appearing. Actually I had to go to the original downloaded file and click “unblock” since the AddIns had also disappeared.
Great site- I am going enjoy using it
I have downloaded and installed Real Stat.
Thank you very much.
Thank you very much for making this suite available to us. Appreciate your efforts (and the “educational” spirit) in crafting a value added option to a popular workhorse for the masses.
Respected sir,
I want find the “relationship between emotional intelligence and math abilities of secondary school students.”
how can i compare emotional intelligence componets &with what type of math abilities get little confusion. piz help in this regards.
Mulla,
You haven’t provided enough information for me to respond in any detail. You could start by exploring the correlation coefficient. Perhaps a t test would be useful.
Charles
I have downloaded the resource pack for Mac many thanks
The control M produces the real stats menu but it does no contain a survival analysis option.. I am trying to perform cox proportional hazards model – why can’t i access survival analysis from menu??
Nisha,
Sorry, but the Mac version of the software doesn’t yet support these capabilities. Currently, they are only supported in the Windows version.
Charles
Dear Charles,
Thanks for an amazing tool. Any idea when you might release a Mac version with survival analysis?
Akash
Akash,
I have the release ready, but I don’t have a Mac to test it on. As soon as I can get a Mac to test on, I will issue the new release.
Charles
That is great news Charles. Here’s hoping you can get to a Mac soon!
Charles I have a Mac by the way. Anyway I can help out remotely with testing your new release?
Akash,
Thanks. I appreciate that. If I can find a Mac to create the release on, then I would be happy to send you the release software to test.
Charles
Thanks for a great tool. I am a NOVICE stat guy just trying to crunch some numbers for fantasy football. The Jenks Natural Breaks algorithm is great for determining the cutoff value for tiers, or what I think you call classes. However, it relies on me telling it how many classes (k) that I want. Is there a way to determine the optimal k? Is it always the case that the larger k is, the better the fit would be? So I guess I would be looking for the lowest k that does not significantly improve with a larger k. If that makes sense, how could I statistically calculate that. I am looking at less than 100 samples, so the number of permutations will not be impossible. Thanks again.
Mike,
Yes, the larger the number of classes the better the fit would be. In fact, the best fit would occur when each data element is in its own class, but this defeats the purpose of the whole exercise.
I don’t know of a statistical test which determines whether a higher number of classes no longer yields a significant difference. With a small sample, you can experiment until you see that a higher number of classes doesn’t seem to matter much. Usually after about 6 classes, the Jenks Natural Breaks algorithm slows down considerably (assuming that you want to test all possible partitions) and so this may be the determining factor in how many classes to consider.
Charles
Dear Professor,
First of all thanks for this great add-in.
But, who write a Tesis, they have to put/write (at least in APA) the p-value.
But, in some tables, special Contrast, Tukey HSD (I use .. )etc, you only put the “sig” and “no” or “yes”.
It is not possible to put the real p-value in next version?
Thank you, very, very much!
José
Jose,
That is a reasonable request. I am in the process of testing the next release and I will try to add this information. In the meantime, for Tukey HSD, you can use the QDIST function to get the p-value.
Charles
Hi Charles, thanks for your Excel add-in.
This is very beneficial for me as I am not fortunate enough to have Minitab or SPSS in my official system.
I have installed Real Statistics as per instruction given on site. but when I am trying to use a function by pressing Ctrl +m and selecting the function and data an error comes “Compile error in hidden module: frmMatrix ”
This is happening with each and every function.
please help.
windows 7 ultimate, 32- bit OS, =VER() turns out to 4.5 EXCEL 2007
I am sorry, but I don’t know what is causing this problem. I am using Real Statistics with Excel 2007 without any problems, but other Excel 2007 users have run into problems similar to yours. I suggest that you look at the comments on the following webpage to see what others have suggested.
https://real-statistics.com/free-download/real-statistics-resource-pack/real-statistics-resource-pack-excel-2007/
In particular, the following suggestion may be useful
“Copy the downloaded file to /Microsoft Office/Office12/Library/Analysis , then restart excel. Then install in normal way.”
Charles
Merci beaucoup
Came across this hidden gem . I’m a data scientist and mostly play around with R. But this is helpful for my colleagues who are not comfortable with R and not fortunate enough to have Minitab or SPSS in their machine. At least its a stop-gap arrangement where we could run statistical tests locally before communicating findings.
Thanks
Hi,
I am seeing in other posts there is a cluster analysis included but when I download this version I do not see it? Do I need an upgrade?
Nicole
Nicole,
You should find it under the Multivariate menu choice. If you don’t see it there then you will need to upgrade.
Charles
Hi Charles, thanks for your Excel add-in.
The option of logistic regression does not appear in the dialog box .
I have the 2013 Excel.
Thank you again.
Choose the Regression option. On the next dialog box that appears, choose the Logistic Regression option.
Charles
I downloaded your add-in and I playing with it now. I have a question, not directly related to the add-in – Excel contains the following functions SUMSQ, SUMX2MY2, SUMX2PY2 and SUMXMY2, what practical applications do these functions have – where would on use them?
Thanks,
Shane
Shane,
SUMSQ is used very often in statistics: to compute variance, Durbin-Watson, regression, length of vector, etc.
SUMXMY2 is used for calculating Durbin-Watson and in K-means cluster analysis
Since SUMX2MY2(R1, R2) = SUMSQ(R1) – SUMSQ(R2) and SUMX2PY2(R1, R2) = SUMSQ(R1) + SUMSQ(R2), they seem much less useful to me.
Charles
Hi Charles. Thanks for the availability of this excel add-in. I have attempted to run the SlopeTest function (Excel 2013) and the output is only on cell, the Std Err value. There are no other cells reported. Any suggestions? Thanks
Lee,
The SlopeTest function is an array function; i.e. the output requires more than one cell. You need to follow the instructions on the webpage Array Functions and Formulas.
Charles.
Thanks for the quick reply Charles. An oversight on my part. Everything is now working perfectly. Sorry for the inconvenience.
Charles, the toolbar opens, but whe I try to run any function it returns the same error as if I access trough the supplement.
Charles, I get the software version: 3.8.1 Excel 2007. When I try to access the realstat tool bar it returns a system error &H80004005 (-21476467229). Non specified error and then a compilation error in the hidden module frmlnput.
In fact, I can use the functions directly (and in fact I do use them this way), but turns the process unproductive.
Andre
Andre,
What happens if you press Crtl-m instead of accessing the realstats toolbar?
Charles
Andre,
This seems to be a known bug in Excel. Most people are using the Excel 2007 version of the Real Statistics software without any problems. A few people have reported some problems getting access to the software, but as far as I am aware this the first time this bug has been reported.
If you google “Excel error message &H80004005 (-21476467229)” you will see information about the bug. The webpage http://peltiertech.com/unspecified-painfully-frustrating-error/ seems to summarize the situation well.
Since the bug is only indirectly related to the Real Statistics software, if at all, I don’t know what to suggest. Please let know whether you were using a previous release of the software, in which I can send a copy of that version to you.
Charles
Hi, I’m using a brazilian portughese version of excell and installing the realstat2007 version. But when I try to access the resource pack it returns a non specified error and indicates that it may probably be due to a problem running the hidden module. Do you have any clue on how to solve this? Thanks a lot.
Andre
Andre,
I don’t know why you are getting this error message. What do you get when you enter the formula =VER()? In the error message does it state which hidden module is causing the problem?
Charles
I followed your directions and got to the dialogue box in fig. 2 but each time I send a command it shows a notice; “Compile error in hidden module: Analysis”. How can I solve this problem Sir. Dear Charles, VER() gives 3.6.2. My excel is 2007.
Dear Charles, VER() gives 3.1.2. I have installed the 2010 version on another pc, windows server 2008 r2, and it seem to work. Thank you.
Thank You for your great job. I get “Compile error in hidden module: Analysis” while using the “ctrl-m” part of the module. My excel is 2007, SO is Windows XP.
Marco
Marco,
What do you see when you enter the formula =VER() in any cell?
Charles
I followed your directions and got to the dialogue box in fig. 2 but each time I send a command it shows a notice; “Compile error in hidden module: Analysis”. How can I solve this problem Sir.
Charles
Which version of Excel are you using? Which version of the Real Statistics Resource Pack are you using? (you can find this out by enterring the formula =VER() in any cell).
Charles
It is a very useful website. How do I calculate the CORNALPHA using the Resource Pack? I do not think there is an option if and when I press Ctrl+m
Regards