The sign test is a basic non-parametric test that can be applied when the conditions for the one-sample t-test are not met. The test itself is very simple: perform a binomial test (or use the normal distribution approximation when the sample is sufficiently large) on the signs of the data elements as described in the following example.
Example
Example 1: A company claims they offer a therapy to reduce memory loss for senile patients. To test this claim, they take a sample of 15 patients and test each patient’s percentage of memory loss, with the results shown in range A3:B18 of Figure 1. Determine whether the therapy is effective compared with the expected median memory loss of 20% over the same period of time.

Figure 1 – Sign test for Example 1
As can be seen from the histogram and QQ plot in Figure 1, the data are not normally distributed, and so we decide not to use the usual parametric test (the t-test). Instead, we use the sign test with the null hypothesis:
H0: the population median ≥ 20
To perform the test, we count the number of data elements whose value is larger than 20 and the number of data elements whose value is smaller than 20, dropping any data elements with a value of 20 from the sample. This is accomplished by putting +1 in column C if the corresponding data element in column B is > 20, -1 if the data element is < 20, and 0 if the data element is = 20.
The number N+ of data elements > 20 (cell B21) is calculated by the formula =COUNTIF(C4:C18,1). Similarly, the number N- of data elements < 20 (cell B22) is calculated by the formula =COUNTIF(C4:C18,-1). The revised sample size N (cell B23) is given by the formula =B21+B22 (where the elements with a value of 20 are dropped).
Test Result
If the null hypothesis is true, then the probability that a data element is > 20 is .5, and so we need to determine the probability that 4 out of 14 data elements are less than the median given that the probability on any trial is .5, i.e.
p-value = BINOM.DIST(4, 14, .5, TRUE) = .0898 > .05 = α
Since the p-value > α (one-tailed test), we can’t reject the null hypothesis, and so cannot conclude with 95% confidence that the median amount of memory loss using the therapy is less than the usual 20% median memory loss.
Note that we have used a one-tailed test. If we had used a two-tailed test instead, we would double the p-value calculated above. Also, note that in performing a two-tailed test, we would perform the test using the smaller of N+ and N-, which for this example is N+ = 4 (since N- = 10 is larger).
Worksheet Function
Real Statistics Function: The Real Statistics Pack provides the following function:
SignTest(R1, med, tails) = the p-value for the sign test where R1 contains the sample data, med = the hypothesized median, and tails = the # of tails: 1 (default) or 2.
This function ignores any empty or non-numeric cells.
Referring to Figure 1, we see that this function can be used to obtain the values SignTest(B4:B18,20) = .089783 and SignTest(B4:B18,20,2) = .179565.
Data Analysis Tool
You can also use Real Statistics’ Non-parametric Tests data analysis tool to perform the sign test. Click here for additional information.
Observations
Generally, Wilcoxon’s signed-ranks test is used instead of the sign test when the conditions for the t-test are not met since not only the signs are taken into account but also the ranking of the data, thereby giving more accurate results.
With data that is ordinal but not interval, the Wilcoxon Signed-Ranks test cannot be used, and so the Sign Test could be the only available choice.
Just as the paired-sample t-test is a one-sample t-test on the sample differences, the same is true for the paired-sample sign test, as described in Paired Sample Sign Test. The sign test version of the two independent sample test is called Mood’s Median Test.
Confidence Intervals
We can estimate confidence intervals based on the sign test as shown in Figure 2.
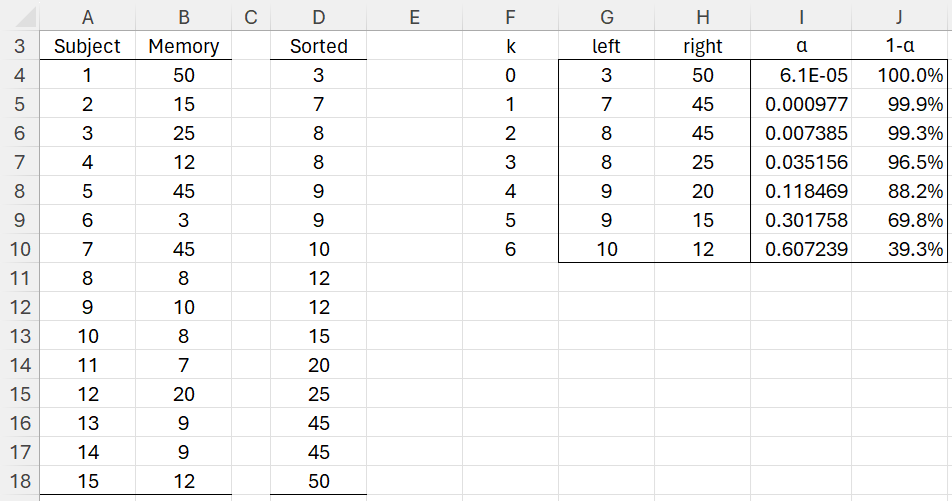
Figure 2 – Confidence Intervals
We begin by sorting the data as shown in column D. E.g. range D4:D18 contains the Real Statistics array formula =QSORT(B4:B18). We next calculate symmetric confidence intervals as shown on the right side of Figure 1. Here, cell G4 contains the formula =D4, cell H4 contains =INDEX($D$4:$D$18,A$18-F4), cell I4 contains =2*BINOM.DIST($F4,A$18,0.5,TRUE), and cell J4 contains =1-I4.
We obtain the other values on the right side of the figure by highlighting G4:J10, and pressing Ctrl-D. For example, [8, 25] is a 96.5% confidence interval, and [9, 20] is a 88.2% confidence interval.
Examples Workbook
Click here to download the Excel workbook with the examples described on this webpage.
Links
References
Zar. J. H. (2010) Biostatistical analysis 5th Ed. Pearson
Stricker, D. (2016) Brightstat nonparametric tests
https://secure.brightstat.com/index.php?p=c&d=1&c=2
Howell, D. C. (2010) Statistical methods for psychology (7th ed.). Wadsworth, Cengage Learning.
https://labs.la.utexas.edu/gilden/files/2016/05/Statistics-Text.pdf
Hi Charles,
Are any of these tests similar to the Friedman test? I am working with some non-detect data and might need to use rank-sum.
Thanks
Hi Pierce,
I am not sure what you mean by “similar”. Many of these use ranking.
Charles
Hello
I am interested in calculating a non-parametric test in an event study approach. Is it possible to get an explanation of how to do this in Excel?
Hello Tchai,
I am not an expert in this area, but here are some websites that demonstrate the event study methodology and how to conduct it in Excel. For each step in the process, I suppose that you can replace the parametric approach via a non-parametric approach. The Real Statistics website describes various non-parametric processes that can be used.
https://www.eventstudytools.com/introduction-event-study-methodology
https://www.eventstudytools.com/excel
https://www.youtube.com/watch?v=449N0BFNIEM
Charles
Hello Charles,
Thank you for your explanation. It was very helpful.
My question is would you use the same method if you had a sample greater than 25? Would you still use the binomial distribution function or would you use something else to get the p-value?
Hello Keiar.
I would still use the binomial distribution, although I could use the normal distribution approximation to the binomial distribution, as described at
Normal Approximation of the Binomial Distribution
Charles
Dear Charles,
Thanks for the work you are doing.
I need to determine whether the participants in my survey agree with my hypothetical value for the thing I am evaluating or not. I need a non-paramatric test. I had skewness issue using Wilcoxon test, so ended up using the sign test. I have the following doubt:
1. I am interested in mode not median, as I need to know how many people agree with me, can I use this test?
2. If the p-valus is equal and greater than .05 we fail to reject or if it is greater only?
Sali,
1. I don’t know of any test for the mode
2. I tend to use p-value < alpha, but all of this is somewhat arbitrary: you can consider p-value = alpha as borderline. Charles
Sali,
What you describe can best be measured with a binomial distribution where “agree with me” = TRUE => “success” and “agree with me” = FALSE => “failure”.
Dear Charles,
Thank you for the very useful package and website!
Could you please explain to a statistics newbie what is meant by “the hypothesized median” above? The default value in the package seems to be 0. Does this mean that the default assumption here is that there is no difference between the two sides of the distribution (i.e. that there is an equal number of -1s and +1s)? What puzzled me was that it is possible to change this value in the package and obtain different p-values. Should one just leave it as 0 under ‘normal’ circumstances?
Many thanks in advance!
Cem
Dear Cem,
What to set the hypothetical median to depends on what hypothesis you are trying to test. If you are trying to test that two populations are the same, then the default of zero would be appropriate. What is the null hypothesis that you are trying to test? Also, the sign test is kind of a last resort; generally, you would prefer to use a t-test or a test such as Mann-Whitney. Why did you elect to use a sign test?
Charles
Thank you for the explanation and sorry for my late response Charles. Let me give you more information about my study.
I conducted what is called a forced-choice task aiming to test grammatical judgments. In this task, the participants are given a pair of sentences and asked to select the one they feel is more acceptable. They can also select the third alternative of the two sentences being equally good or bad. According to the literature you can only run a sign test on the responses of a forced-choice task. So I assigned the sign 1 to Sentence 1 of a given pair being selected, -1 to Sentence 2 of the pair being selected, and 0 to the third alternative, and tried the sign test. For most cases I expect one of the sentences to be more acceptable than the other. So my null hypothesis is that the two populations (i.e. the two sentences) are the same, and I am trying to reject the null hypothesis. There are also a few cases where the two sentences are equally good or bad, and I expect the null hypothesis to hold in these cases.
Is this the correct reasoning and procedure here?
Hello Cem,
This seems like a reasonable approach based on using the sign test.
Charles
Wonderful! Thank you, Charles!
Hi Charles, great page and software.
I would like to know if there is a method based on the sign test to construct a confidence interval for the median of one sample.
Rob,
You can use an approach similar to that for Signed Ranks Test. See
https://real-statistics.com/non-parametric-tests/wilcoxon-signed-ranks-test/signed-ranks-median-confidence-interval/
You can also look at https://www.scribd.com/presentation/75941305/Confidence-Interval-for-Median-Based-on-Sign-Test
Charles
Good way of explaining, and pleasant paragraph to obtain information regarding my presentation topic,
which i am going to deliver in institution of higher education.
hi charles
how to use sign test in excel
steps by steps pls
Pl send solution of below Q on pawan62003@yahoo.com.
3. A physical instructor claims that a particular exercise when done continuously for 7 days, reduces body weight at least by 3.5kg. Five overweight girls did the exercise for 7 days and their body weights were found as under:
Girls 1 2 3 4 5
Weight before exercise 70 72 75 71 78
Weight after exercise 66 70 72 66 72
Making use of the sign test, verify the claim at α = 0.05 that the exercise reduces weight by at least 3.5kg.
You can use the approach shown on the referenced webpage or simply use the SignTest function.
Charles
Hello Charles,
Thank you for your extensive work on making stats in Excel easier.
I’m working on a baseline-intervention trial for which I have perfect information on the baseline population. I took a stratified sample out of this population to select people on which I apply treatment. I’m running group comparison tests on the intervention sample vs. baseline sample. Unfortunately, the baseline population data shows non-normality (negative skew and a small 2nd mode), to the point I cannot use Wilcoxons test. I am opting for Mood’s median test or sign test.
A) Is is it possible to calculate sign test on the median of the baseline population and then allocate -1/+1/0 on the treatment sample? Or should I use Mood’s test? I have paired samples (same person in baseline and intervention).
B) Can I use Sign test by calculating the difference between treatment and baseline, saying that 0-hypothesis is no change, then allocating +1/-1/0 in function of whether data is bigger or smaller or equal to 0? BINOM.DIST(number_obs_smaller, count_obs, 0.5, TRUE)?
C) Is it right to dismiss Wilcoxon’s because of light bimodality and skew? Does the population data have to be strictly symmetrical or can I run it in confidence?
Sorry, I have a lot of questions. Thank you in advance in case that you find the time to answer :-).
Marc,
Here are my answers to your questions, assuming that I have understood the problem correctly.
1. Mood’s test requires that your two samples be independent. If I have understood your scenario correctly, the two samples are not independent, and so you shouldn’t use Mood’s test.
2. To use Wilcoxon’s ranked-ranks test, you need to look at whether the differences between the paired samples are reasonably symmetric. It is possible that the baseline data is not symmetric, but these differences are symmetric.
3. If the assumption for Wilcoxon’s test is not met (either as a paired samples test or a one sample test vs. the median), you can use the Sign test (as paired samples or one sample test).
Charles
Thank you for your reply Charles. I didn’t think about that. I was thinking to much about the population distribution. After all, I am testing if the observed difference can be generalized on the popuation…
The distribution of the difference between the paired samples (treatment-baseline) is roughly symmetric. I got 8% of observation differences that are out of symmetry (outliers with huge differences). I guess the gain in reliability is not worth the loss of power when switching from Wilcoxon’s paired test to Sign test.
Hi Charles,
Apologies, but I am new to statistics, so I appreciate your help. I recently administered a pre- and post-lesson survey – -responses ranged along a 5-point likert scale, from strongly disagree to strongly agree. I numbered responses, so that strongly agree =5, and strongly disagree=1. I would like to statistically confirm that there was a change after the intervention, however, although the changes are consistent, they are modest — typically from neutral to agree, or neutral to strongly agree, and they are not normally distributed, i.e. no one started lower than neutral and no one ended up lower than neutral. do you have any recommendations for a good test?
Kate,
This sounds like the typical paired t test. You need to check whether the differences between the scores after minus before are approximately normally distributed or at least symmetrical. If not you can use the paired version of the Wicoxon Signed Ranks test instead.
Charles
Hi Charles,
I am looking for a solution to the problem below, but unable to clearly state the null hypothesis, can you please help with the soultion
A physical instructor claims that a particular exercise when done continuously for 7 days,reduces body weight at least by 3.5kg. Five overweight girls did the exercise for 7 days and their body weights were found as under:
Girls 1 2 3 4 5
Weight before exercise 70 72 75 71 78
Weight after exercise 66 70 72 66 72
Making use of the sign test, verify the claim at αlpha = 0.05 that the exercise reduces weight by at least 3.5kg.
H0: mean of weight after – mean before – 3.5 < 0, which of course you are trying to disprove. Charles
Thanks Charles.
In the given problem, weight is found to be reduced by 4, 2, 3, 5, & 6 Kgs in case of 5 girls. This gives 2 (-) and 3 (+) signs if compared to the claimed reduction of 3.5 kgs.
Can I state the null hypothesis as
H0: Weight reduced is >= 3.5 Kg
&
Ha: Weight reduced < 3.5 Kg
now for n=5 and p=0.5 how to accept or reject the H0 ? this is confusing me ….
Sorry, but now I don’t understand the problem you are trying to solve.
Charles
this is an interesting case of one sample sign test
Dear Charles- Thanks again for statistical interpretation on excel. Earlier also i have gained immense knowledge from this website. Help me understand one thing here: i want to set up a goal for a cycle time metric for which i have the population data and have taken a sample out of that. As the data is non-normal, can i go for one-sample sign test to set up a statistically validated target for my project? Will that test be same one as the sign test explained above. If my baseline is 74.5 days CT, what target shall i take up? Can you show with an example? Many Thanks in advance
Uttam,
Sorry, but I don’t completely understand your question. What null hypothesis are you trying to test? Often (but not always) when the sign test can be used, the Wilcoxon signed ranks test gives better results. Did you consider using this test?
Charles
Sir,
Normally, They also include H1: Alternative. Why it isn’t?
The alternative hypothesis is simply the complement of the null hypothesis and so it isn’t always explicitly stated. For the first problem on the referenced webpage, H0: population median ≥ 20 and so H1: H0: population median < 20. Charles
Dear Charles,
Thank you so much, you provide a really extensive and informative size of information.
I conducted an event study on M&As, and calculated t tests, but after normality test I decided to conduct a nonparametric testing.
As you know, in event studies we end up having a table of abnormal returns for all companies (AR) separately, average abnormal returns of all companies (AAR) and cumulative AR (CAAR), as follows:
AR AR AR AR AAR CAAR
0.1 0.2 0.3 0.01 …….. ,,,,,,,,,
and as a summary we would have
(-X, 0) t (-X, +X) t (-X, +1)
-0.71% -0.243 -1.82% -0.350 -0.74%
after reviewing the literature, I want to conduct a GRANK testing in excel.
what is the formula to be applied and at which levels (estimation and event windows?) first table or on cumulative data of second window?
If I want to apply other tests like; Sign Test, Mood’s Median Test, Wilcoxon Rank Sum Test, Mann-Whitney Test, Wilcoxon Signed-Ranks, McNemar’s Test, how can they be applied in the case of event study? what are the 2 samples we are testing against.
your support is highly appreciated.
Best wishes
Mo,
I am quite interested in supporting event studies in my website and software, but haven’t had the time as yet to get to this. I plan to do so, but it will take some time yet.
Charles
Hi Charles,
Could you please help me to discuss TWO INDEPENDENT SIGN TEST? I was looking for different sites but I am wondering I could not find a sample easy to understand or the sign test discussion was for one sample only or for correlation.
Thanks!
Alie,
I have described Mood’s Median test as a two (or more) sample version of the Sign Test. See https://real-statistics.com/non-parametric-tests/moods-median-test-two-samples/ for details.
Charles
I wonder how to draw the QQ-plot,in Microsoft Excel or other Statistical Software,please inform
Please look at the following webpage: https://real-statistics.com/tests-normality-and-symmetry/graphical-tests-normality-symmetry/
Charles