Creating confidence intervals for the median using the Signed Ranks test is similar to creating confidence intervals for the Mann-Whitney test (see Mann-Whitney Confidence Interval), although we need to use something called the Walsh averages.
Example
Example 1: Find the 95% confidence interval for the median based on the data in Example 1 of Wilcoxon Signed-Ranks Test (repeated in range A3:D18 of Figure 1).
There are 15 difference values z1, z2, …, z15 (range D4:D18). For any 1 ≤ i ≤ j ≤ 15, we define the Walsh average to be wij = (zi + zj)/2. There are 15(15+1)/2 = 120 such Walsh averages. These are shown in range G4:U18. E.g. w11 (cell G4) can be calculated by the formula
=IF(ROW(F4:F18)-ROW($F$4)<=COLUMN(G3:U3)-COLUMN($G$3),($F4+G$3)/2,””)
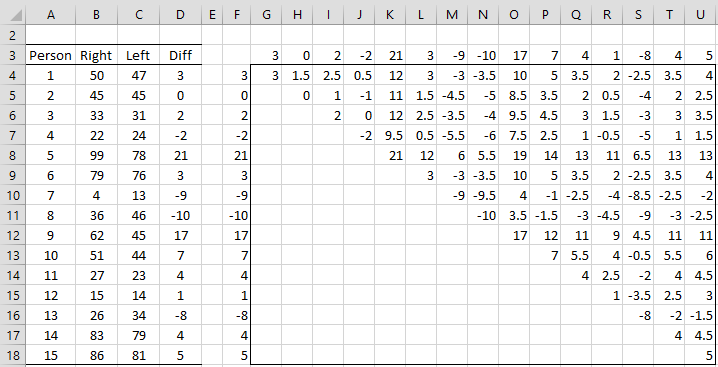
Figure 1 – Set-up for Signed Ranks confidence interval
Using the table of critical values in Signed-Ranks Table, we see that the two-tailed critical value for α = .05 is 25 when the sample size is 15. Alternatively, we can use the SRankCRIT function as shown in cell X5 of Figure 2.
The 95% confidence interval is bounded by the 25th smallest and 25th largest values in range G4:U18, as shown in cells X7 and X8 of Figure 2, resulting in the requested 95% confidence interval of [-2.5, 6.5].
The median of all the values in range G4:U18, called the Hodges-Lehmann median, is 2.5 (cell X9). This can be used as an alternative effect size measurement.
As we did for the Mann-Whitney test (see Mann-Whitney Confidence Interval), we also calculate a confidence interval based on the critical value plus 1, as shown in cells X12 and X13.
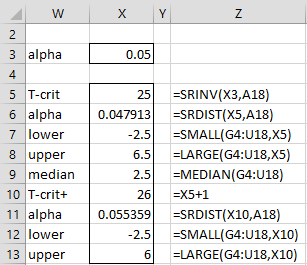
Figure 2 – Signed Ranks confidence interval
Observations
Since we eliminate any differences that equal 0 when performing the signed-ranks test, we can also do the same when calculating a confidence interval. In this case, we need to eliminate row 5 and column H from the data in Figure 1.
We can also create confidence intervals based on the normal approximation. In this case, the ranks of the lower and upper bounds of the confidence interval are
![]()
where zcrit = the critical value for the standard normal distribution when α/2 = .025.
Worksheet Function
Real Statistics Function: The Real Statistics Pack provides the following array function to calculate the confidence interval based on the pairwise differences between the values in R1 and R2 where alpha is the significance level (default .05).
SR_CONF(R1, R2, lab, type, alpha, nzero): returns a 9 × 1 column array containing the lower and upper bounds of the 1 – alpha confidence interval and the Hodges-Lehmann median. If lab = TRUE (default FALSE) then an extra column with labels is included in the output. When nzero = TRUE (default), then differences between values in R1 and R2 that are zero are not included in the analysis.
If type = 0 (default), then the normal approximation is used; if type = 1, then PERMINV and PERMDIST are used (as explained in Signed-Ranks Exact Test).
There is also the following version of the SR_CONF function that calculates the confidence interval for the one-sample Wilcoxon signed-ranks test, where the differences are between the values in range R1 and the constant med (default 0).
SR_CONF(R1, med, lab, type, alpha, nzero)
Examples
For Example 1, the worksheet array formula =SR_CONF(B4:B18,C4:C18,TRUE,1,,FALSE) returns the values shown in range W5:X13 of Figure 2. We get the same result if we use the array formula =SR_CONF(D4:D18,,TRUE,1,,FALSE).
Note that the same output is generated using the normal approximation, i.e. the array formula =SR_CONF(D4:D18,,TRUE,0,,FALSE), except that the value in cell X6 is .046826 and the value in cell X11 is .053474. As for the Mann-Whitney confidence interval, the first of these values is less than or equal to the alpha value of .05, and the second is greater than the alpha value.
If instead, we want to eliminate the pairwise differences that equal zero, then we can use the array formula =SR_CONF(B4:B18,C4:C18,TRUE,1) or =SR_CONF(D4:D18,,TRUE,1). The result is displayed in Figure 3.
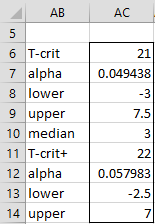
Figure 3 – Alternative version of the confidence interval
The version using the normal approximation is similar, except that cell AC19 contains the value .04799 and cell AC24 contains the value .055533.
Examples Workbook
Click here to download the Excel workbook with the examples described on this webpage.
Links
References
Wikipedia (2018) Wilcoxon signed-rank test
https://en.wikipedia.org/wiki/Wilcoxon_signed-rank_test
Howell, D. C. (2010) Statistical methods for psychology (7th ed.). Wadsworth, Cengage Learning.
https://labs.la.utexas.edu/gilden/files/2016/05/Statistics-Text.pdf
Stack Exchange (2016) Prove the relationship between Walsh averages and Wilcoxon signed rank test
https://stats.stackexchange.com/questions/215889/prove-the-relationship-between-walsh-averages-and-wilcoxon-signed-rank-test
SAS (2019) Hodges-Lehmann estimation of location shift
https://documentation.sas.com/doc/en/statug/15.2/statug_npar1way_details19.htm
Hi Charles,
Thank you for providing such detailed information of your site. I was wondering if you might be able to help me with a query? I am currently analysing a dataset of n=55 involving scores of self-rated skills before and after attending a training course. I have tried calculating upper and lower bounds through both the n(n+1)/4… formula given, and through the =SRINV part of the excel package. Each of these methods give quite different critical T values (around 700 for the former, and 500 for the latter), and so I wasn’t sure which would be more appropriate for me to use? Either way, a lot of the Walsh averages I have computed are duplicates as the differences in my dataset are similar – this means the median and lower/upper bounds are all the same number (2.5). Does this indicate an error in my calculations? Or that it’s not appropriate for me to being using this method to compute a CI for my dataset?
Thank you,
Chloe
Hello Chloe,
If you email me an EXcel file with your data and test results, I will try to figure out why there is such a difference.
Charles
Hello Charles,
Please, if you can help me, I would appreciate it. This is my situation:
I am doing a study about how the appraisal value of real estate properties relate to their market value. My main variable is the Ratio, that is, the quotient: AppraisalValue/MarketValue.
The mean or median of these ratios, according to international standards, must be between 0.9 and 1.1, so that means that the appraisal is almost similar to the true value (market value).
My sample consist of 60 properties, each with its respective Ratios. According to the bibliography, the ratios generally do not follow a normal distribution, and tend to be asymmetric, so it is recommended to use the median, and its respective confidence interval. It also says that as long as the confidence interval has some overlap with the range between 0.9 and 1.1 the standard is achieved.
I´ve still couldn´t complete my sample, so I can´t tell for sure right now if the normality nor the symmetry condition of the ratios are met. Therefore, I assume the worst scenario…
That being said:
The procedure you explain here is a paired one based on differences, how should I proceed in my case? Should I follow the same procedure (where my Ratios would be what you call “Zi and Zj”)? Is it ok to take this path considering that the lack of normality and asymmetry invalidate the use of Wilcoxon, although n=60?
I know your time is valuable and I appreciate your attention thank you very much.
Tomás.
Tomás,
The signed ranks test does not assume normality. Although I haven’t investigated this in detail, I don’t believe that the Hodges-Lehmann approach requires symmetry either. Probably the approach described on this webpage is applicable for your situation, but I don’t have enough knowledge about these ratios to say for sure.
Charles
Hello Charles,
First of all, thanks for this great site, I´ve learned a lot since I found it.
I have a basic understanding of statistics, I´ve never heard about this kind of tests (Wilcoxon, Mann – Whitney, etc) before, so I am a little bit lost here.
Please, if you can help me, I would appreciate it. This is my situation:
I am doing a study about how the appraisal value of real estate properties relate to their market value. My main variable is the Ratio, that is, the quotient: AppraisalValue/MarketValue.
The mean or median of these ratios, according to international standards, must be between 0.9 and 1.1, so that means that the appraisal is almost similar to the true value (market value).
My sample consist of 60 properties, each with its respective Ratios. According to the bibliography, the ratios generally do not follow a normal distribution, and tend to be asymmetric, so it is recommended to use the median, and its respective confidence interval. It also says that as long as the confidence interval has some overlap with the range between 0.9 and 1.1 the standard is achieved.
I´ve still couldn´t complete my sample, so I can´t tell for sure right now if the normality nor the symmetry condition of the ratios are met. Therefore, I assume the worst scenario…
That being said:
1- The procedure you explain here is a paired one based on differences, how should I proceed in my case? Should I follow the same procedure (where my Ratios are what you call “Zi and Zj”)? Is it ok to take this path considering that the lack of normality and asymmetry invalidate the use of Wilcoxon, although n=60?
2 – It is not clear to me if this confidence interval is based on the Signed test or the Wilcoxon, since I´ve found a page with this same procedure (based on the normal approximation) and says it´s based on Wilcoxon test. Here is the link: https://support.minitab.com/en-us/minitab/18/help-and-how-to/statistics/nonparametrics/supporting-topics/calculate-the-estimated-median-and-confidence-interval-for-the-1-sample-wilcoxon-test/
3 – Finally, an alternative approach to my problem I considered is to make a signed test:
If my median turns out to be >1.1, then I will have to test Ho<1.1
If my median is 0.9
So, as I see it, wouldn´t this be similar to checking if the confidence interval overlap some of the range 0.9-1.1? If I accept my Ho, then the standard is achieved.
Would be ok this approach?
I know your time is valuable and I appreciate your attention, thank you very much.
Tomás.
Tomás,
I believe that I have addressed your questions in 1 and 2 in my previous response (at least to the best of my knowledge).
Regarding item 3, the signed test can be used in place of the signed-ranks test, although it has less power (a negative aspect), but has fewer assumptions (a positive aspect). I can’t comment about the use of the confidence interval of .9 to 1.1 since I am not familiar with the research that shows that this is the correct interval to use.
Charles
Sorry, I wrongly sent the first comment.
Thank you very much for the response Charles.
I´ve tried the approach described on this webpage and it gave me a narrower confidence interval than the binomial approach for the same sample of ratios. Does it necessarily mean its more powerful?
Thank you again.
Tomás,
It means that it is more precise and likely more accurate.
Charles