Real Statistics Data Analysis Tool: The Real Statistics Resource Pack provides the Resampling data analysis tool that supports the following tests:
- One-sample test (on the sample mean, median, 25% trimmed mean, or variance)
- Two paired samples (on the difference between sample means, medians, 25% trimmed means, or variances)
- Two independent samples (on the difference between sample means, medians, 25% trimmed means, or variances)
- One-sample correlation test (on the correlation coefficient)
- ANOVA (on the F statistic)
Bootstrapping can be used for all of these tests, while randomization (permutation) can be used for all but the first.
We describe the first three of these tests on this webpage. We provide links for the other two tests below.
Bootstrapping Example
Example 1: Repeat Example 1 of Resampling (one-sample bootstrap) using the Resampling data analysis tool. The data for this example is shown in range B3:B23 of Figure 2.
Press Ctrl-m and select the Resampling option from the Misc tab (or double-click on the Resampling option if using the original user interface). Next, fill in the dialog box that appears as shown in Figure 1, and click on the OK button.
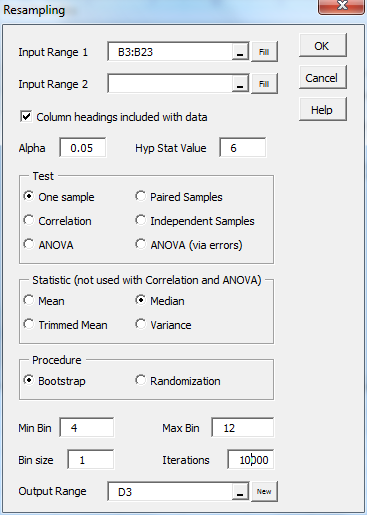
Figure 1 – Resampling dialog box
This time, we not only calculate the 95% confidence interval for the median. but we also calculate the p-value under the null hypothesis that the median is 6. We specify that 10,000 iterations are performed, and a histogram of outcomes, with minimum and maximum bin sizes of 4 and 12 in increments of 1 unit. The output is shown in Figure 2 (slightly reformatted).

Figure 2 – One-sample bootstrap
Results
We see from Figure 2 that the p-value for a two-tailed test is 0.0189 (cell E24) with a 95% confidence interval for the median of (6.5, 11.0). Since the hypothetical median (cell E18) of 6 is outside the confidence interval (and the p-value < α = .05), we reject the null hypothesis and conclude that the population median is significantly different from 6.
We also note that the sample median is 9.5 (cell E21) while the average value of the 10,000 medians is 9.413 (cell H20) with a standard deviation of 1.413 (cell H21). The p-value for a one-tailed test (left tail) is .0188 (cell E22) and the p-value for the right tail is .0001 (cell E23).
Since there are 10,000 iterations and α = .05, the lower end of the confidence interval is the 1,000 · .025 = 250th smallest of the bootstrapped medians, while the upper end of the confidence interval is the 250th largest of the bootstrapped medians. The left p-value is equal to the number of bootstrapped medians smaller than 6 (the value of the median under the null hypothesis). Since the sample median minus the hypothetical median = 9.5 – 6.0 = 3.5, the right p-value is equal to the number of bootstrapped medians larger than 9.5 + 3.5 = 13.
Data Analysis Tool Options
For a One-sample test, only Input Range 1 is used in the dialog box shown in Figure 2. For the other tests, the range of the first sample is entered in Input Range 1 and the second is entered in Input Range 2. Alternatively, a two-column range can be entered in Input Range 1 where the first sample is contained in column 1 of the input range, the second sample is contained in column 2 of the input range, and Input Range 2 is left empty.
The Hyp Stat Value (hypothetic statistic value) is only used for the One-sample and Correlation tests. For the one-sample test, this is the value that you hypothesize as the value of the selected population statistic (mean, median, 25% trimmed mean, or variance). For the one-sample correlation test, this is the hypothesized value of the population correlation.
You insert the number of iterations in the Iteration field. Any value up to 10 million can be selected, although you should recognize that the larger this value, the more accurate the result, but the slower the calculations.
For bootstrapping, a histogram of the selected statistic is displayed using your values for the minimum and maximum bin values and bin size. In addition, the p-value and confidence interval are displayed (as shown in Figure 2). The confidence interval values are displayed only when the number of iterations is 65,000 or less. For randomizations, a histogram and p-value are displayed, but not a confidence interval.
Permutation Test Example
Example 2: Perform a two-tailed randomization test for the two independent samples shown in range A3:B14 of Figure 3.
In addition to the two samples, Figure 3 displays the results of the t-test and Shapiro-Wilk test for normality. As we can see, the data are normally distributed; the first sample has a mean of 44.25 while the second sample has a mean of 29.50, although the two-tailed t-test shows no significant difference between the population means (p-value = .07).
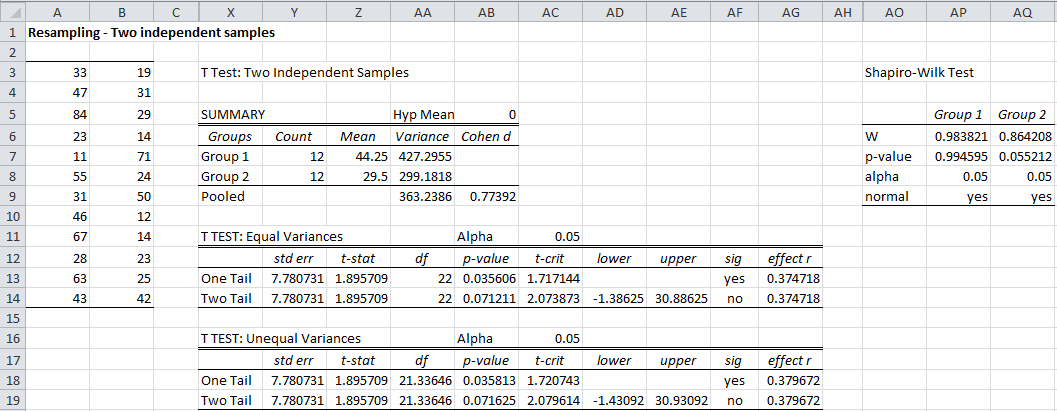
Figure 3 – Test of two independent samples
To carry out the randomization test, press Ctrl-m and double-click on the Resampling data analysis tool. When the dialog box shown in Figure 1 appears, fill in Input Range 1 with A3: B14 and leave Input Range 2 empty (or insert A3:A14 in Input Range 1 and B3:B14 in Input Range 2). Make sure that Column headings included with data option is unchecked and check the Independent samples, Mean, and Randomization checkboxes.
Since we are performing a randomization test, the histogram will be centered around the mean value under the null hypothesis, namely zero. We, therefore, choose to use minimum and maximum bin values of -22 and 22, and bina size of 2.
Results
Note that since the difference between the means of sample 1 and sample 2 is 44.25 − 29.50 = 14.75, if we had chosen to perform bootstrapping, we would have chosen a bin minimum and maximum shifted about 15 units to the right.
The result of the randomization is shown in Figure 4 (slightly reformatted).
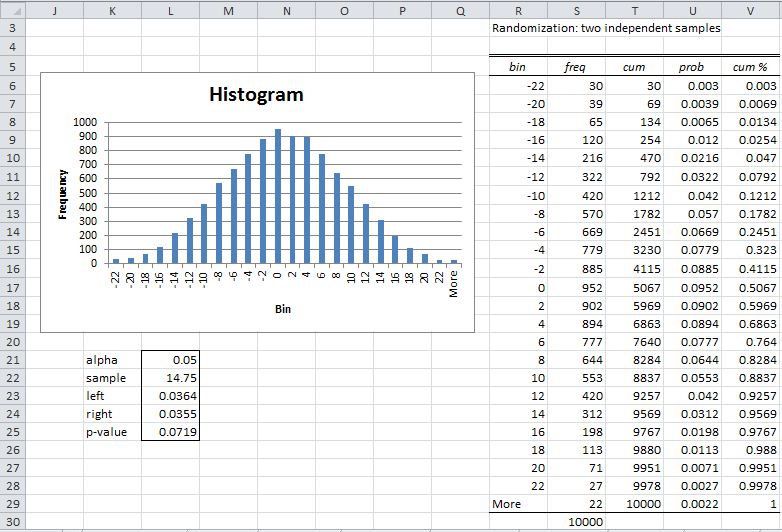
Figure 4 – Randomization two-sample independence test
The fact that the data are normally distributed is confirmed by the shape of the histogram in Figure 4. Furthermore, the p-value = .0719 (cell L25), which is quite similar to the p-value resulting from the t-test (cell AC19 of Figure 3). This is not surprising, since the data are quite normally distributed.
Observations
The randomization version of the two-paired samples test is as described in Resampling. The bootstrap version is equivalent to a one-sample bootstrap test on the differences between the sample elements (e.g. range D3:D18 of Figure 5 for Example 3 in Resampling).
For examples of how to use the Resampling data analysis tool for correlation testing and ANOVA, see
Examples Workbook
Click here to download the Excel workbook with the examples described on this webpage.
Links
References
Howell, D. C. (2010) Statistical methods for psychology (7th ed.). Wadsworth, Cengage Learning.
https://labs.la.utexas.edu/gilden/files/2016/05/Statistics-Text.pdf
Efron, B. and Tibshirani, R. J. (1993) An introduction to the bootstrap. Springer
Dear Charles,
Is there a specific reason for not calculating the confidence interval for p-value obtained from the randomizing (permutation) test?
Thanks & regards,
Bernard
Hello Bernard,
1. First of all, as you probably know, confidence intervals are for the statistics/parameters under study (the mean, median, difference between means, etc.), and not the p-value
2. As described in https://real-statistics.com/non-parametric-tests/resampling-procedures/
“Generally bootstrapping is used for determining confidence intervals of some parameter, while randomization is used for hypothesis testing.”
Thus, for a confidence interval, you should use bootstrapping.
Charles
I have been using the resampling tool to bootstrap datasets of between 30 and 1000 values. The mean and limits obtained seem entirely reasonable.
However, I was experimenting with attempting to execute the command from a filtered data table of 30,000 values. I learned this didn’t work, but I also learned that under those conditions the binning gave a very strange result- all the resampled values fell into one bin.
Is this something to do with the number of iterations (I have stuck to 2000), or is there something else I should be aware of?
Should I increase the number of iterations according to the number of values in the sample?
Thanks for any suggestions
Andy,
I expect that you would need at least 10,000 iterations, and probably more.
I suggest that you try 10,000 a few times and see whether the results differ by much. If so, then increase the number of iterations. You need to use a number of iterations whereby the results don’t change much if you repeat the bootstrapping with the same number of iterations.
Charles
Charles
Hi Sir,
I have collected the data based on 5 point likert scale(very low, low, neutral, high,very high) on the factor considered by individual before making investment decision. There are five factors (D.Vs) Influencing investment decisions. I am interested in knowing whether there is significant difference in preference level of male and female(IVs) for the above said factors. I have applied Permutational Manova in adonis function of R, since data are ordinal in nature, and result is non significant. I have read in literature that permutation test is non parametric in nature. Does for the permutation test equality of variance is highly important. Also the computation of mean, S. D and variance are discouraged by many scholars for ordinal data.
Pls through some light of permutation test and it’s assumption and violation of it. Shall be highly obliged.
Thanks
Imran
Hello Imran,
I am sorry, but I have not yet implemented Permutation MANOVA for Real Statistics and I have not used the R version.
Charles
Where is the ‘subset’ sample size user-defined with this tool?
If I have a dataset of n=100 values, and I take 1,000 random samples of all those values where the random sample size = 100, the mean for each sample would always be the same. But if I randomly sample a ‘subset’ of my n=100 values—-say 25 samples, calculate a mean for each sample, plot it, toss them back in (random replacement), and do this 999 more times, I would most likely have all unique mean values for my samples. Your tool seems to do this without allowing the user to specify the ‘subset’ sample size—-is there a default percentage random sample subset size that it uses? I’m not clear on this, can you explain it? Thank you.
OK—-I found it Charles—-I clicked on the ‘Resampling’ link at the top of the article and saw that there is ‘sampling with replacement’ used for the way each value is sampled. This was what I was missing and had overlooked—-so it all makes sense to me. You may remove my first post and this comment if you wish.
Very useful tool. However what I would like to do is not to sample the whole dataset but to take samples of (say) 10 values from a data set of (say) 100 values with replacement, and do this (say) 1,000 times, and then look at the statistics of those 1,000 samples. Is that possible with the bootstrap tool? At the moment I use something like =INDEX($A$2:$A$101,RANDBETWEEN(1,100)) and then pull this across for the size of my sample (eg 10) and down for the number of iterations (eg 1,000).
Thanks.
Tim,
This seems like a good approach, but the Real Statistics data analysis tool expects to use the entire data set.
Charles