Basic Concepts
The trinomial test provides similar functionality to the sign test but has the advantage of better utilizing data pairs of equal value (i.e. ties), thereby achieving better statistical power than the sign test.
For the paired version of this test, with samples {x1, …, xn} and {y1, …, yn}, we define zi = xi – yi. For the one-sample version with median med, we define zi = xi – med. We now define n+ = # of zi > 0, n– = # of zi < 0 and n0 = # of zi = 0, and so n = n+ + n– + n0.
Finally, we define p0 = n0/n and p(z) for z = 0, …, n, based on a trinomial distribution, by
![]()
Also, p(-z) = p(z) for such z. For any z = d (where d = |n+ – n-|), we have a significant result when P(d) < α in a one-tailed test or P(d) < α/2 (or equivalently, 2P(d) < α) for a two-tailed test where
![]()
Example
Example 1: Use the trinomial test to determine whether the population medians of the variables M1 and M2 are significantly equal based on the sample shown in columns B and C of Figure 1.
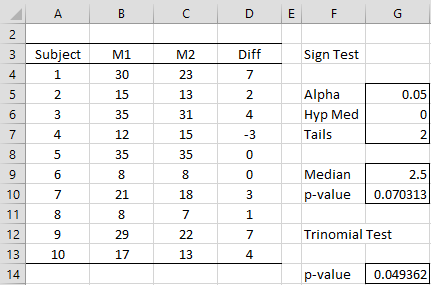
Figure 1 – Sign and trinomial tests
The null hypothesis is H0: μ1 = μ2, and the alternative hypothesis is H1: μ1 ≠ μ2; thus, we conduct a two-tailed test. It follows that n = 10, n+ = 7, n– = 1, n0 = 2, and so d = |n+ – n-| = 6 and p0 = 2/10 = .2.
The sign test supports the null hypothesis since p-value = .070. We now describe how to conduct the trinomial test to obtain a significant result when p-value = .049.
The calculations for the trinomial test are displayed in Figure 2.
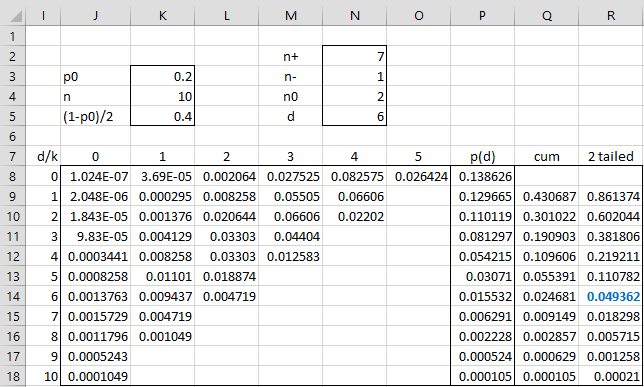
Figure 2 – Trinomial Test
We calculate p(d) for d = 0, …, 10. We begin by placing the following formula in cell J8.
=IFERROR(FACT($K$4)/(FACT($I8+J$7)*FACT(J$7)*FACT($K$4-$I8-2*J$7))*$K$5^($I8+2*J$7)*$K$3^($K$4-$I8-2*J$7),””)
We then highlight the range J8:O18 and press Ctrl-R and Ctrl-D. Next, we place the formula =SUM(J8:O8) in cell P8, highlight the range P8:P18, and press Ctrl-D.
We now calculate the P(d) values by placing the formula =P18 in cell Q18 and the formula =P9+Q10 in cell Q9. Next, we highlight the range Q9:Q17 and press Ctrl-D. Since we are conducting a two-tailed test, we double the values in column Q and insert these values in column R. Since d = 6, we see that p-value = .049362, as shown in cell R14.
Worksheet Functions
Real Statistics Functions: The following functions are provided in the Real Statistics Pack:
TRINOM_TEST(d, n0, n, tails) = p-value for the trinomial test where d, n0 and n are as described above
TrinomTest(R1, R2, tails) = p-value of the trinomial test for the data in R1 and R2
TrinomTest(R1, med, tails) = p-value of the trinomial test for the data in R1 versus the median med (default = 0).
Here, tails = 1 or 2, default = 1.
For Example 1, TRINOM_TEST(6, 2, 10, 2) = .049362. Similarly, TrinomTest(B4:B13, C4:C13, 2) = .049362. In fact, it is also the case that TrinomTest(D4:D13, 0, 2) = .049362.
Examples Workbook
Click here to download the Excel workbook with the examples described on this webpage.
Links
Reference
Bian, G., McAleer, M., Wong, W-K (2009) A trinomial test for paired data when there are many ties
https://econpapers.repec.org/RePEc:eee:matcom:v:81:y:2011:i:6:p:1153-1160
Whitaker, D. (2021) TrinomialTest.R
https://github.com/douglaswhitaker/GridItemTools/blob/master/R/TrinomialTest.R
Hi,
When there is a tie using the two tailed test, I get a p-value greater than zero. For example, if
d = 0, n_0 = 10, n = 14 I will get a p-value of 1.201. Am I doing something wrong?
Sorry, Joe. There is a bug in the software. The one-tailed test value is 0.60032, but the two-tailed test shouldn’t be twice this value. I will fix this in the next release, which should be available shortly.
Dear Mr. Zaiontz,
I was wondering if you could perhaps help clarify something. I would assume the trinomial distribution is simply a specific version of the multinomial distribution.
Using your example data the counts are 7 with a positive difference, 1 with a negative difference, and 2 with no difference. The expected counts simply n times (1 – p0)/2 for the positive and negative, and n times p0 for the tied scores.
However, when I run a multinomial test with this, I get about double the p-value result as you get with the trinomial (2-sided).
I was wondering if perhaps my assumption is wrong that the trinomial dist. is just a specific version of the multinomial dist, if perhaps simply doubling the one-sided p-value with the trinomial is incorrect, if I’m making a calculation error, or something else.
Hope you can clarify.
Kind regards,
Peter
Hello Peter,
Are you saying that the p-value for the multinomial distribution test for Example 1 is 2 x .049362 = .098724?
How did you calculate this value?
I believe that the trinomial distribution is a special case of the multinomial distribution. But if I remember correctly, the trinomial test is different from a typical multinomial test — although I may be wrong about this.
Charles
I figured out my mistake. When using the multinomial test, I used the n_pos, n_neg, and n_tied, which then nicely informed me about the probability of those counts given the expected proportions or more extreme (rare). However, what was needed for the trinomial test is not those who are more extreme in probability, but equal or more extreme in difference between n_pos and n_neg than the sample.
Once I accounted for that, the results were equal.