Basic Concepts
The Fligner-Policello test is a non-parametric test that is used to determine whether the population medians corresponding to two independent samples are equal. The test assumes that the populations are symmetric about their medians, although the test doesn’t require that the distributions have the same shape nor that their variances be equal.
Suppose that sample X has m elements and sample Y has n elements. For each x in X, define
![]()
where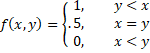
Similarly, for each y in Y![]()
Now define![]()
![]()
![]()
The test statistic is
![]()
That z is approximately standard normally distributed is valid for sufficiently large values of m and n (approximately m, n larger than 12).
Example
Example 1: Repeat Example 2 of Yuen-Welch Test using the Fligner-Policello test. The data is replicated in columns A and B of Figure 1.
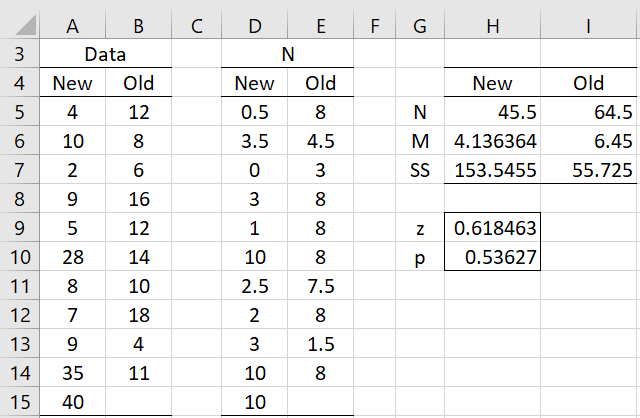
Figure 1 – Fligner-Policello test
For example, cells D5 and E5 are calculated by
=IF(A5=””,””,COUNTIF($B$5:$B$15,”<“&A5)+0.5*COUNTIF($B$5:$B$15,A5))
=IF(B5=””,””,COUNTIF($A$5:$A$15,”<“&B5)+0.5*COUNTIF($A$5:$A$15,B5))
Cell H5 contains the formula =SUM(D5:D15), cell H6 contains =AVERAGE(D5:D15) and cell H7 contains =DEVSQ(D5:D15). Cell H9 contains =(I5-H5)/(2*SQRT(H7+I7-H6*I6)) and cell H10 contains =2*(1-NORM.S.DIST(H9, TRUE)).
Results
Since p-value = .54, we conclude there isn’t a significant difference between the medians.
Note that while the data for Old is quite symmetric around the median, as you can see from Figure 3 of Trimmed Means t Test, the data for New doesn’t appear to be symmetric around the median. On the positive side, skewness for New is 1.2, which is not terribly far from zero, but on the negative side, the mean and median are quite different (14.3 vs. 9.0). Thus, it is not clear whether the assumption for this test has been met.
Worksheet Functions
Real Statistics Functions: The following functions are provided in the Real Statistics Pack:
FPSTAT(R1, R2) = the Fligner-Policello test statistic for the data in column arrays R1 and R2.
FPTEST(R1, R2) = p-value of the Fligner-Policello test for the data in column arrays R1 and R2.
For Example 1, =FPSTAT(A5:A15, B5:B15) returns the value shown in cell H9, while the formula =FPTEST(A5:A15, B5:B15) returns the value shown in cell H10.
Data Analysis Tool
Click here for information about a Real Statistics data analysis tool that supports the Fligner-Policello Test.
Examples Workbook
Click here to download the Excel workbook with the examples described on this webpage.
Links
References
Hollander, M., Wolfe, D. A. (1999) Nonparametric statistical methods, 2nd ed. Wiley
Fong, Y., Huang, Y. (2018) Modified Wilcoxon-Mann-Whitney test and power against strong null
https://www.ncbi.nlm.nih.gov/pmc/articles/PMC6422344/