Overview
The Trimmed Means t-test can often address departures from normality, especially those due to the presence of outliers. We describe the two-sample version of the trimmed means t-test. Essentially this is a t-test using the trimmed means of each sample as the means and the Winsorized variances as the variances (see Outliers and Robustness).
Test
Let x̄ and ȳ be the trimmed sample means of two sets of data of size nx and ny respectively. Suppose that the percentage p% of trimming is the same for both samples (which is not the same as saying that the number of elements trimmed is the same) and so the trimmed sample sizes are mx and my respectively. Let sx and sy be the standard deviations of the Winsorized samples using the same percentage p%. Then based on the null hypothesis that the population trimmed means are equal
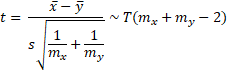
where![]()
Example
Example 1: Use the trimmed means t-test to determine whether there is a significant difference between the perceptions of the new and old flavorings from Example 1 of Two-Sample t-Test based on the data in columns A and B of Figure 1.
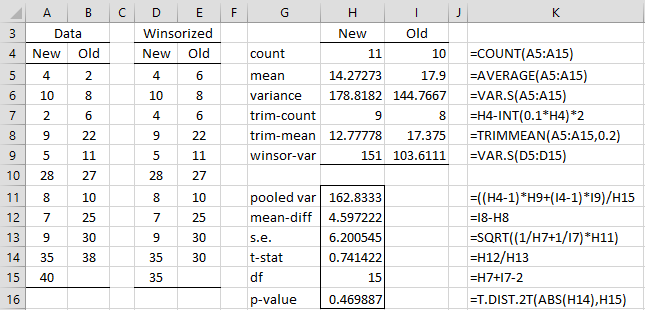
Figure 1 – Trimmed means t-test
The test results are shown in Figure 1. Column K shows the formulas used in column H (those in column I are similar). As can be seen from cells H7 and H8, 20% trimmed means are used. Columns D and E contain the Winsorized data for the New and Old flavorings respectively. E.g. range E5:E15 contains the array worksheet formula =WINSORIZE(A5:A15,0.2).
Since the p-value = .47 (cell H16), we conclude that there isn’t a significant difference between the two flavorings. If we had used the usual t-test we would have gotten a p-value = .65.
Normality Testing
As can be seen from Figure 2, the data for the New flavoring does not seem to follow a normal distribution, while the data for the Old flavoring does.

Figure 2 – Normality testing
Note too that the values in cells H6 and I6 in Figure 1 are not very different, which indicates that we can assume that the population variances of the two samples are equal (also confirmed by the Box Plot shown in Figure 3). In fact, we used the trimmed means test since the normality assumption was violated but the equal variances assumption was not.

Figure 3 – Box plots
Worksheet Function
Real Statistics Function: The Real Statistics Resource Pack provides the following function.
TRIMTEST(R1, R2, lab, p, tails): outputs a column array with the values: t-stat, df, p-value for the trimmed means t-test on the data in R1 and R2 based on the trim percentage p (default 0.2). If lab = TRUE a column of labels is appended to the output (default FALSE). tails = 1 or 2 (default 2).
For Example 1, the output from the worksheet array formula =TRIMTEST(A5:A15,B5:B15,TRUE) is as displayed in range G14:H16 of Figure 1.
Data Analysis Tool
Click here for information about a Real Statistics data analysis tool that supports the Trimmed Means t Test.
Examples Workbook
Click here to download the Excel workbook with the examples described on this webpage.
Reference
Peter Statistics (2025) Trimmed mean t-test for independent samples
https://peterstatistics.com/Terms/Tests/TrimmedMeansIS.html#:~:text=As%20the%20name%20implies%2C%20this,test%20uses%20the%20regular%20mean.