Basic Concepts
The one-sample hypothesis test described in Hypothesis Testing using the Central Limit Theorem using the normal distribution is appropriate when one knows the standard deviation of the population distribution and the population is either normally distributed or the sample is sufficiently large that the Central Limit Theorem applies.
The problem is that the standard deviation of the population is generally not known. One approach for addressing this is to use the standard deviation s of the sample as an approximation for the standard deviation σ for the population. A better approach is to use the t-distribution.
Pdf and basic properties
Definition 1: The (Student’s) t distribution with k degrees of freedom, abbreviated T(k) has the probability distribution function (pdf)

where Γ(y) is the gamma function, as described in Gamma Function.
Key statistical properties of the t distribution are:
- Mean = 0 for k > 1
- Median = 0
- Mode = 0
- Range = (-∞, ∞)
- Variance = k ⁄ (k – 2) for k > 2
- Skewness = 0 for k > 3
- Kurtosis = 6 ⁄ (k – 4) for k > 4
The overall shape of the probability density function of the t distribution resembles the bell shape of a normally distributed random variable with mean 0 and variance 1, except that it is a bit lower and wider. As the number of degrees of freedom grows, the t distribution approaches the standard normal distribution, and in fact, the approximation is quite close for k ≥ 30.

Figure 1 – Chart of t distribution by degrees of freedom
Other properties
Property 1: If x has the normal distribution N(μ, σ2), then for samples of size n with mean x̄ and standard deviation s, the random variable
![]()
has distribution T(n – 1).
Click here for a proof of Property 1.
Property 2: For samples of sufficiently large size n with mean x̄ and standard deviation s, the random variable
![]()
has distribution T(n – 1).
Proof: This follows from Property 1 by the Central Limit Theorem.
Observations
The test statistic in Properties 1 and 2 are the same as
![]()
from the Central Limit Theorem with the population standard deviation σ replaced by the sample standard deviation s. What makes this so useful is that usually, the standard deviation of the population is unknown while the standard deviation of the sample is known.
When the sample makes up a substantial portion of a (finite) population (e.g. more than 5%), then the standard error s/
![]()
where N is the population size.
Worksheet Functions
Excel Functions: Excel provides the following functions for the t distribution:
T.DIST(x, df, cum) = the probability density function value f(x) for the t distribution when cum = FALSE and the corresponding cumulative distribution function F(x) when cum = TRUE.
T.INV(p,df) = the value x such that T.DIST(x, df, TRUE) = p, i.e. the inverse of T.DIST(x, df, TRUE).
In addition, Excel provides the following worksheet functions:
T.DIST.RT(x, df) = the right tail at x of the t distribution with df degrees of freedom
T.DIST.2T(x, df) = the sum of the right tail of the t distribution with df degrees of freedom at x plus the left tail at -x, where x ≥ 0 (the function yields an error value when x < 0).
T.INV.2T(p, df) = the value x such that T.DIST.2T(x, df) = p, i.e. the inverse of T.DIST.2T(x, df)
Note that the right tail at x, T.DIST.RT(x, df) = 1 – T.DIST(x, df, TRUE). Since the t distribution is symmetric about x = 0, the left tail at –x is also T.DIST.RT(x, df) and the sum of the right and left tails, T.DIST.2T(x, df) is 2* T.DIST.RT(x, df).
Since the t distribution is symmetric about x = 0, we have the following equivalences:
T.DIST (-x, df, TRUE) = 1 – T.DIST (x, df, TRUE) = T.DIST.RT(x, df)
T.DIST.RT(-x, df) = 1 – T.DIST.RT(x, df) = T.DIST (x, df, TRUE)
T.INV(1-p, df) = T.INV.2T(2*p, df) for p ≤ .5
Generally, we use T.DIST.RT and T.DIST.2T for the one-tailed and two-tailed t-tests respectively. We use T.INV(1-p, df) and T.INV.2T(p, df) for the one-tailed and two-tailed critical values respectively.
Worksheet functions for older versions of Excel
Excel Functions: The above functions are not available for versions of Excel prior to Excel 2010. For Excel 2007 and earlier versions, the following functions are used instead, where x ≥ 0, df > 0 and tails = 1 or 2:
TDIST(x, df, tails) = T.DIST.RT(x, df) if tails = 1 and = T.DIST.2T(x, df) if tails = 2
TINV(p, df) = T.INV.2T(p, df)
These functions are described in more detail in Built-in Statistical Functions.
Figure 2 provides examples of the use of these Excel worksheet functions.
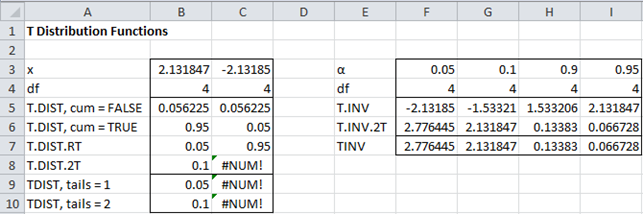
Figure 2 – Examples of t distribution functions
Functions for non-integer df
Real Statistics Functions: In all the Excel functions that support the t distribution, the value of df is rounded down to the next lower integer. Thus, df = 3.7 is treated the same as df = 3. Furthermore, for versions of Excel prior to Excel 2010, there is no function equivalent to T.DIST(x, df, FALSE), i.e. there is no function that provides the pdf for the t distribution.
To address these issues, the Real Statistics Resource provides the following functions:
T_DIST(x, df , cum), T_DIST_RT(x, df), T_DIST_2T(x, df)
T_INV(p, df), T_INV_2T(p, df)
Except for the fact that the df is not rounded, these functions are identical to their standard Excel counterparts.
Examples Workbook
Click here to download the Excel workbook with the examples described on this webpage.
References
Wikipedia (2012) Student’s t-distribution
https://en.wikipedia.org/wiki/Student%27s_t-distribution
Nelson, S. L. and Nelson, E. C. (2021) How to use t-distributions in Excel
https://www.dummies.com/article/technology/software/microsoft-products/excel/how-to-use-t-distributions-in-excel-152342/
Hi Charles
Thanks for your “Significance Testing of Pearson Correlations in Excel” which is (at last) me to get ever closer to a single figure for expressing whether a correlation is significant. I have been looking for such for a long time, so I can apply this to many correlations one at a time, to use later to compare these with other dependent variable sets.
However, I am still a bit unsure how to implement this – you present, for me, a confusing array of alternatives when I just need one.
What I am hoping for is, having computed the correlation in my Excel, to have a single formula (however complicated) that returns a single figure – say, these two variables are significantly correlated at the 95% or 99% level, so unlikely to be just be chance.
Then having this figure, apply an IF test such that “if these two variables are correlated significantly at this X% level, then the slope of the trend line indicates how much they are correlated.
All the last para I can easily do. It is the in the para before that I am still uncertain about.
I cannot understand how, for a particular correlation, to test its significance when your t.inv and t.dist examples appear to give a significance figure independent of the correlation – when surely that has to be involved somehow? What am I missing here please?
Hello Ian,
I suggest that you look at the following webpage.
https://real-statistics.com/correlation/one-sample-hypothesis-testing-correlation
The first three options describe three different ways of addressing your question. Since you are only trying to test whether two variables are significantly correlated (i.e. the correlation coefficient is significantly different from zero) at the 95% or 99% level, I suggest that you select the first option.
Charles
Hello Charles,
Apologies for being slow in getting back to you (I had been checking initially daily, but your answer didn’t pop up on my screen until a couple of days ago) – and thank you for taking the time to help me.
I think I understand up to where I check for both tails, and here I also think I’ve got it right, but would appreciate you confirming this if you don’t mind.
First I do a correlation, checking I’ve to an n>10 (below which I’m not comfortable with – in this case, n = 256):
E282=IF(E275<$B$280,"",CORREL(E$3:E$274,$VC$3:$VC$274))
I then find the t:
E283=E282*SQRT(E275-2)/SQRT(1-E282^2)
I then calculate T.Dist:
E284=T.DIST(E283,E275-2,2)
And finally I check whether this correlation is significant to 99.99%, and, if so, what is the slope or b value:
E285=IF(E284="","",IF(OR(E284(1-$B$281)),SLOPE(E3:E274,$VC$3:$VC$274),””))
In this case I get E285 = -0.197 as the slope and so the amount that the variable VC is changed by E
I’m doing this along 300+ variables to see which ones possibly influence VC one way or the other and which ones I can ignore – I do another check elsewhere to see how the same 300+ variable relate to 20 other dependent variables, which are metrics of biometrics which in essence should all be coherent.
Kind regards, Ian
Hello Ian,
I can’t tell from your comment what spreadsheet example you are referencing.
Can you tell me where this spreadsheet is located?
Charles
Thanks Charles for staying with me.
Is it possible for you to access my DropBox link: https://www.dropbox.com/s/2i0jvgkysf9s1ps/LifeStyle151923.xlsm?dl=0
If so, then the sheet I am using for this example is HIITNN50, using a p of 0.01% (shown in B281.
I tried a Snip of my spreadsheet, but I don’t think your webpage accepts that.
Kind regards, Ian
Ian,
You can just email me an Excel spreadsheet. My email address is available at Contact Us.
Charles
Is it okay to take an average of t-statistics which are given in the output of multiple linear regression? Other statistics like correlation are not additive, however, the Fisher’s Z scores and R squares can be averaged. Are t-statistics additive – that’s my main question? Please let me know.
Thanks
Navaldeep,
You can certainly take the average of the t statistics, but I can-t think of any use for such an average.
Charles
Hi Charles,
Is there a reference to cite in favour of averaging t-statistics? I need it for my meta-analysis.
Thanks
Navaldeep,
I don’t know of any such reference.
Charles
HEllo Charles,
What is the meaning of t.dist results. For example, if i get 0.011489364 for t.dist, what does this number imply?
This is the value of the T distribution. If the cum argument is TRUE then this is the cumulative distribution value (often viewed as the p-value), while if it is FALSE then this is the probability density value.
Charles
Hi Sir Charles, my professor told me that in running a correlation in excel there must be three tables, i think one of them is a t-test table. He told me that in the final table it shows which variable has the most significant correlation. I’m asking if you happen to know how to make these three tables?
Gilbert,
Sorry, but I don’t know what three tables he/she is referring to.
Charles
Hello Charles,
I’m having problems calculating my degrees of freedom as I have to work out VaR using the t-distribution on Excel. I tried to rearrange the formula to d=2v/v-1, but I am getting -0.000314724, which doesn’t seem write. I got an error when using the T.INV function, showing #NUM! .
If you could figure this problem out, please help!
Thank you
Heta
Hello Heta,
Sorry, but I don’t understand the situation you are describing. T.INV will produce an error if the df is less than 1.
If you send me an Excel file with your data and calculation I will try to figure out what is going on. You can get my email address at Contact Us.
Charles
Typo:
What makes this useful is that usually the standard deviation of the population is unknown while the standard devastation (sic) of the sample is known.
Peter,
Thanks for identifying this “devastating” typo. I have now corrected the webpage, although I am devastated that I didn’t catch it sooner. All joking aside, thanks for your help.
Charles
hey, charles Good job. i have a doubt in my project, i need to find out t- test for each of my sample. In order to get the final analysis of my project i need it, but i cant make it out can u help me please.
Gopi,
How to proceed depends on the specific t test that you need to perform. You can select the required test from the webpage https://real-statistics.com/students-t-distribution/. E,g, for the one sample t test, see https://real-statistics.com/students-t-distribution/one-sample-t-test/.
Charles