Basic Concepts
We can employ the same approach to create a confidence interval for a noncentrality parameter and, in turn, Cohen’s effect size as we used to calculate a confidence interval for the population mean (or the difference between population means).
We demonstrate two techniques for finding a confidence interval for Cohen’s effect size of the one-sample t-test. The approach for paired and independent t-tests is similar.
Confidence interval for effect size
Example 1: Find the 95% confidence interval for the effect size for Example 2 of One Sample t Test.
We duplicate the data from the example in Figure 1. The figure also contains the results of the one-sample t-test on this data based on the null hypothesis that the population mean is 78.
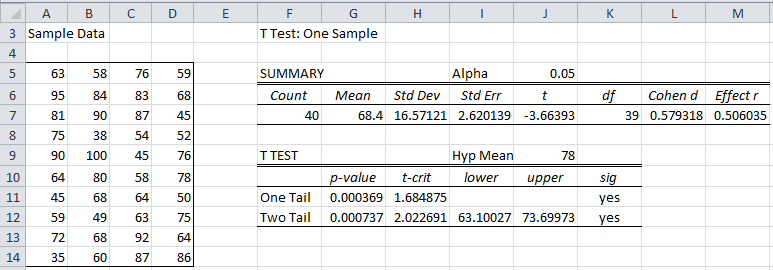
Figure 1 – One sample t-test
We see that Cohen’s effect size d is 0.579318 (cell L7). Since the sample mean of 68.4 (cell G7) is less than the hypothesized population mean of 78 (cell J9), we could consider Cohen’s effect size to be -0.579318, but we will continue to assume that the effect size is the positive value.
Using Goal Seek
To find the 95% confidence interval for d, we first find a 95% confidence interval for the noncentrality parameter δ. One of the endpoints of this interval is the value of δ such that NT_DIST(t, df, δ, TRUE) = .025 where t = 3.66393 (the absolute value of cell J7) and df = 39 (cell K7). We now show how to find the value of δ using the Goal Seek tool.
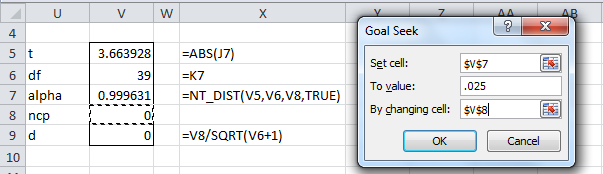
Figure 2 – Calculating δ using Goal Seek
The formulas in Figure 2 reference the cells in Figure 1. After the OK button in the Goal Seek dialog box is pressed, the worksheet values change to those shown in Figure 3.
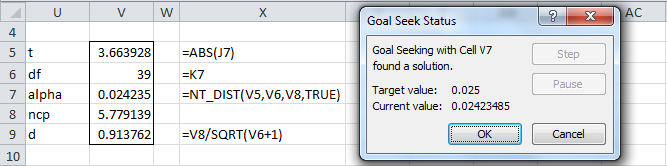
Figure 3 – Results from Goal Seek
The value of δ calculated is 5.779139 (cell V8). Since δ = d

In a similar fashion, we calculate the other endpoint of the confidence interval by finding the value of δ (and subsequently of d) such that NT_DIST(t, df, δ, TRUE) = .975. Again we do this via the Goal Seek tool to get a value for δ of .151 with a corresponding value for d of .23875.
Thus the 95% confidence interval of d is (.23875, .91376), which is a fairly wide range for d = .5693.
Using the NT_NCP function
The confidence interval for the effect size can also be calculated using the NT_NCP function (see Noncentral t Distribution). Figure 4 shows how this is done for Example 1.

Figure 4 – Calculating d and δ using NT_NCP
This time we see that the endpoint of the 95% confidence interval for d corresponding to .025 is .911483 (cell V18). If we plug .975 into cell V16 we get .240791 for the other endpoint, which yields a confidence interval of (.240791, .911483).
Note that not only is it easier to calculate the confidence interval using the NT_NCP function, but the results are more accurate. This can be seen from the fact that for the Goal Seek calculation NT_DIST(V5,V6,V8,TRUE) = .024235, which is not quite .025, while for the approach using NT_NCP we see that NT_DIST(V14,V15,V17,TRUE) = .025.
Confidence Interval for Power
Once we have a confidence interval for Cohen’s d (or the noncentrality parameter), we can use this interval to find a confidence interval for power.
Example 2: Find the 95% confidence interval for the power of Example 1.
The calculations are shown in Figure 5. The upper part of the figure shows the calculation of the 95% confidence interval for d in a more concise form. The last three rows calculate statistical power based on the three values of d.
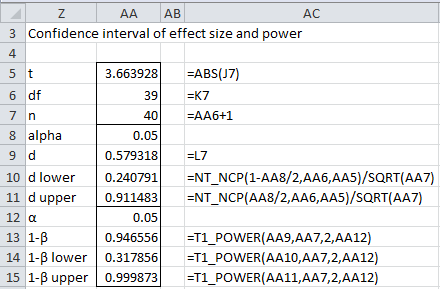
Figure 5 – Confidence intervals for effect size and power
Note that the alpha in cell AA8 is based on the fact that we want a 95% confidence interval, while the alpha in cell AA12 is based on the significance level desired for the t-test (and power calculation).
We see that although we calculate 94.66% power, a 95% confidence interval for power is (31.79%, 99.99%). This indicates that we need to be quite cautious about how we use the 94.66% power figure since the actual power can be as low as 31.79% with 95% confidence.
Examples Workbook
Click here to download the Excel workbook with the examples described on this webpage.
References
Howell (2010) Confidence intervals on effect size
https://www.uvm.edu/~statdhtx/methods8/Supplements/MISC/Confidence%20Intervals%20on%20Effect%20Size.pdf
Lecoutre B., (2007) Another look at the confidence intervals for the noncentral t distribution
https://digitalcommons.wayne.edu/jmasm/vol6/iss1/11/
Steiger, J. H., Fouladi, R. T. (1997) Noncentrality interval estimation and the evaluation of statistical models
https://statpower.net/Steiger%20Biblio/Steiger&Fouladi97.PDF
Hello Charles,
The figure-1 has effect -r mentioned in the column M.
I am getting a very high cohen-d value of 5.7 in paired t-test with 5 elements. How to interpret it? The corresponding effect r is 0.98.
What does effect-r indicate and how do we interpret this value.
Sujatha
The general guidelines are that r = .1 is viewed as a small effect, r = .3 as a medium effect and r = .5 as a large effect.
Cohen suggested that d = 0.2 be considered a ‘small’ effect size, d = 0.5 represents a ‘medium’ effect size and d = 0.8 a ‘large’ effect size.
See also
https://www.simplypsychology.org/effect-size.html#:~:text=Cohen%20suggested%20that%20d%20%3D%200.2,if%20it%20is%20statistically%20significant.
The values that you observed for d and r demonstrate a huge effect.
Charles
Why is it that when r and d are converted to each other, they yield different interpretations? Examples:
d = 0.80 (large effect) converts to r = 0.37 (medium-to-large effect)
r = 0.5 (large effect) converts to d = 1.16 (huge effect)
I’m baffled by this.
Hi William,
Very interesting observation. It seems to show how arbitrary some of these interpretations are.
Using the conversion from r to d shown at https://real-statistics.com/correlation/dichotomous-variables-t-test/, I found the following for two samples of the same size: if r = .1 then d = .20 (approx.), if r = .3 then d = .61, if r = .5 then d = 1.12. The exact values depend on the sample sizes. Thus, d is approximately double r, but the guidelines are not double.
Also if the samples have different sizes then d can be much higher than twice r when r = .1. E.g. if r = .1 and the sample size are 10 and 70 then d = .30 (as expected). But for r = .3 or r = .5 it is almost impossible to achieve d = .5 and d = .8.
Charles
Hello,
My excel does not recognize NT_NCP. Is there another name in newer / older versions that I should try instead?
Hello Sarah,
If you are using an old version of Excel, this function may not be supported by Real Statistics. If you are using any version of Excel starting with Excel 2010 on a Windows PC or Excel 2016 on the Mac, then you only need to download the latest version of the Real Statistics software to get access to this function.
Charles
I cannot find t_effect1 & tt_effect1 functions in Real Statistics
Am I wrong?
O, I found it, a version issue.
Hi Charles, I have two independent groups with more than 50 subjects in each one of them, I computed Cohen’s d and its standard error, can I use this method for computing the CI of d:
ME = 1.96 × SE
CI = d ± ME
Sam,
This is fine provided you have a calculated the SE for the effect size (and not the means) correctly. This webpage explains how to calculate SE correctly, Another approach for calculating SE is provided at https://real-statistics.com/students-t-distribution/two-sample-t-test-equal-variances/confidence-interval-for-two-sample-cohens-d/
Charles
As always very helpful, thank you so much.
How do I compute Effect Size 95% CI for Independet t test in spss
Oyenuga,
Sorry, but I don’t use SPSS, only Excel.
Charles
Dear Charles,
I would like to know how to compute confidence intervals for omega squared effect size derived from an one-way repeated measures ANOVA.
Lucio,
I haven’t tried to address this issue yet, but you should be able to find some information on the Internet — e.g.
http://epm.sagepub.com/content/72/1/68.abstract
Charles
Many thanks for the paper Charles!!
Thanks for this, Charles. This is the most accessible explanation I’ve found for computing a confidence interval for a one-sample d. I tried applying the same approach to independent-samples ds (I’m working on a project where I need to be able to compare different kinds of effect sizes). As a sanity check, I checked my results against the standard way to compute these CIs (+/- 1.96 * the variance of the effect size), and found that this method produced far smaller CIs. But, if I double the upper and lower bound on those, I get results that are nearly identical to the standard method (certainly within reasonable rounding errors). What I don’t understand is why I need to double them to get results that make sense. Any light you could shed on this would be very appreciated. I’m driving myself mad trying to figure out what is going on here.
Justin,
In the standard way of computing the confidence interval for the effect size, what value did you use for the standard error of the effect size?
Charles