Objective
The objective of a two-sample equivalence test is to determine whether the means of two populations are equivalent based on two independent samples from these populations; here “equivalent” means that the two means differ by a small pre-defined amount. This margin of equivalence is determined by knowledge of the domain under study and represents the tolerance that is acceptable.
A two one-sided t-test (TOST) is used to make this determination. Essentially, TOST reverses the roles of the null and alternative hypotheses in a two-sided t-test.
Hypothesis Test
If θ represents the margin of equivalence, then we test the hypotheses:
H0: μ2 – μ1 ≤ –θ or μ2 – μ1 ≥ θ
H1: –θ < μ2 – μ1 < θ
This is done by conducting two one-sided t-tests, each of which is based on a null hypothesis that is one of the parts of the above null hypothesis. If the null hypothesis of both tests is rejected then the difference falls within the equivalence interval and you can claim that the two population means are equivalent. The larger p-value of the two t-tests is used as the p-value of the TOST.
Another way of looking at this method is to conduct a two-sided t-test and determine the 1–2α confidence interval I. If the confidence interval I lies completely within the interval (-θ, θ) then we accept that the two means are equivalent.
We can also use two different limits for the margin of equivalence, an upper-value θU and a lower-value θL. In this case, θU replaces θ in the TOST method described above and θL replaces –θ.
The TOST approach can also be used for a one-sample test (and similarly for a two dependent sample test). In this case, we test the equivalence between the mean of a single population and some hypothetical mean μ0.
H0: μ – μ0 ≤ θL or μ – μ0 ≥ θU
H1: θL < μ – μ0 < θU
This time we conduct two one-sample t-tests. Alternatively, if the 1–2α confidence interval for the two-tailed one-sample t-test lies completely within the interval (θL, θU) then we accept that the population mean and hypothetical mean are equivalent.
Example
Example 1: A company that markets a premium brand of fresh salmon has found a second supplier, but wants to make sure that the level of omega-3 is within 25 mg of their existing suppliers’ for a 100-gram serving. Using the random sample of 12 servings from each supplier as shown on the left side of Figure 1 determine whether the sources are equivalent based on alpha = .05.
The right side of Figure 1 shows the analysis for a two independent sample t-test. Since the 90% confidence interval (-9.17, 23.33) is completely contained in the interval (-25, 25), we conclude that the two sources are equivalent.
Note that if we test the two one-sided null hypotheses directly, we would obtain p-values of .036 and .0013. Since both are less than alpha = .05, we again conclude that the two sources are equivalent (with p-value = .036).
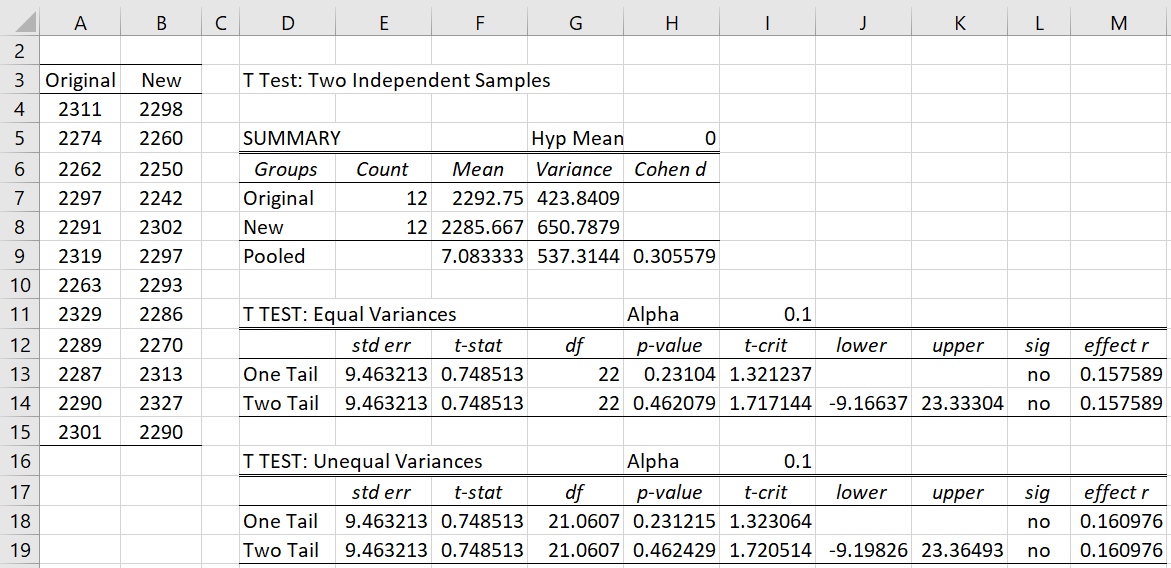
Figure 1 – TOST
Examples Workbook
Click here to download the Excel workbook with the examples described on this webpage.
Reference
Lakens, D. (2017) Equivalence Tests: A Practical Primer for t Tests, Correlations, and Meta-Analyses. Social Psychological and Personality Science
https://www.ncbi.nlm.nih.gov/pmc/articles/PMC5502906/
Limentani, G. B., Ringo, M. C., Ye, F, Bergquist, M. L., McSorley, E. O. (2005) Beyond the t-test: Statistical equivalence testing. GlaxoSmithKline
https://kipdf.com/queue/-statistical-equivalence-testing_5ab5c06c1723dd329c642c9b.html
Hello Charles,
Thank you for this great tool!
I am unsure I’m following the documentation for this test right.
I need to do an equivalence test for two 7-replicate sets of samples (biodiversity metrics from two sites), at the 20% interval (this is to assess compliance with a resource consent, so the number of samples and interval limits are beyond my control).
If I want to follow the two one-sided t-tests’ approach, should the hypothesis mean difference be (±0.2 * (mean of reference site))? Then, if either of the two tests does not reject Ho, they are not equivalent (?)
And if I want to compare the confidence interval with the equivalence interval? Do I assess the lower and upper values against my (±0.2 * (mean of reference site)) outside of your TOST-spreadsheet’s analysis output? Or can I incorporate my 20% somehow?
Thank you very much for your help!
Would this apply to non-normal datasets? Is there a non-parametric version?
Hi Steve,
There is a non-parametric version using the Mann-Whitney test. See, for exxample,
https://aaroncaldwell.us/TOSTERpkg/reference/wilcox_TOST.html
Charles
Dear Charles,
I think that this sentence “Note too that a two-sided t-test would yield a p-value = .46 and so we can also conclude that there is no significant difference between the two suppliers.”
it is not pertinent in an equivalence testing.
The fact that there is a not significant statistically difference between two groups does not mean that are equivalent. My suggestion is to clear it or to stress the difference between an equivalence testing and a standard test between two means.
Best
Bruno
Dear Bruno,
Thank you for your comment.
The referenced statement was meant to be a side comment, but I agree that it is confusing and is not pertinent to the equivalence topic, and so I have removed it.
Thanks again for catching this.
Charles
Hi Charles,
I note that in your example test you calculate the t-statistic based on the absolute value of (M1-M2-Diff). Am I correct in thinking this was done so you could use the right handed t-dist function and consequently this approach becomes invalid if M1-M2 > Diff for the left handed test?
Best
Hi Sean,
If I am looking at the same thing that you are, I take the absolute value so that I can use the two-tailed t-value since T.DIST.2T(x,df) is only valid when x >= 0.
Charles
Hi Charles,
Thanks for a great resource.
I am testing equivalence between two devices, how do I incorporate precision error into the TOST? My criterion method has a greater Least Significant Change than the preset boundary, or do I just have to make the boundary bigger than the LSC? Thank you.
Hi Chris,
Sorry, but I don’t know how to incorporate precision error into TOST.
Charles
Thanks Charles
Hey Charles,
I want to do equivalence testing with a dependent sample (pre-post-design).
I know Lakens (2017) suggests the Welch Test for independent samples, but which test can I use for dependent samples?
Thank you
Pele
Hello Pele,
I am not familiar with equivalence testing for dependent variables. I will look into the paper that you referenced and try to get back to you in a few days.
Charles
I’ve used your website many times and always find it very helpful. Thanks for your work in creating and maintaining this resource!
Your page on Equivalence Testing (TOST) does not contain your usual “Figure 2” showing the Excel formulas used to generate the output shown. Is it possible for that to be added, which would make applying the technique to my dataset easier?
Thanks again!
Hi Dave,
The figure contains the output from the Real Statistics t-Test data analysis tool. I have added a link to the webpage that explains this tool.
I have also added the ability to download the Excel spreadsheet for the example, and so you can see all the formulas used.
Charles
What would the hypothetical mean be in the one-sample t-tests? I have looked thoroughly and it is not discussed in the given example.
Are you asking about the one-sample t-test or about TOST?
Charles
Dont worry I figured it out
Another question, I’ve run through your example successfully without much difficulty, but when I applied the methods to my data, the TOST indicated equivalence, while the two-sample two-sided t-test yielded a confidence interval way outside of the equivalence interval I decided on. I’m pretty sure the TOST is incorrect, as my two samples are pretty obviously not equivalent.
Do you have any ideas as to what could’ve gone wrong? I could give you more specific info if it helps
Hello Isabel,
If you email me an Excel file with your data and results, I will try to figure out what the problem is.
Charles
Dear Charles,
is there any guide we can use to establish equivalence interval/margin, θ?
Thanks.
Alan,
Perhaps the following paper will help.
https://www.ncbi.nlm.nih.gov/pmc/articles/PMC5502906/
Charles
thank you Charles.
But do you have a simpler guide, for example I have seen an approach creating tolerance interval from a data set to compare against the specification limits in order to generate the largest acceptable difference or equivalence bound? is there any other approach we can use as a guide to form the said margin?
Thank you.
Alan,
There are probably such guides, but I am not familiar with them. Sorry.
Charles
it’s ok Charles. You’ve been very helpful!
Thank you so much!
Fritz et al., 2012: Effect Size Estimates: Current Use, Calculations, and Interpretation
in their paper they gave clear values including PS and U1
Thank you very much for sharing this link. It is a useful article.
What is the connection between PS and U1 and TOST?
Charles
hi
sorry I am confused that in Example 1 the alpha we set as 0.05 but in Figure 1 why alpha is displayed as 0.1?
thank you
Alan,
As explained on the webpage, we are looking for the 1–2α confidence interval, which is why the .05 is doubled.
Charles
that means initially alpha is entered as 0.05 when we key in the the variable ranges, only when the test result is tabulated then we change Alpha to 0.1 to get the 90% confidence interval lower and upper limit?
Yes, that is correct.
Charles
hi Charles,
p values we get from one tail and 2 tails are to be compared against which alpha, 0.05 or 0.1?
If you perform two one-tailed tests, you use alpha = .05, but if you use the confidence interval approach then use alpha = .1.
This is explained on this webpage.
Charles
Hi Charles,
Appreciate your article. I am getting acquainted with equivalence testing and your publication helped a lot by noting the different approaches using Excel. I wonder if you could shed some light on how to calculate Theta to run an equivalence test. I am using two softwares (QI Macros and MiniTab) and am struggling to figure out Theta. I am aware that it should be based on historical Standard Deviations or process stringency.
Armando,
This depends on why you want to use an equivalence test in the first place. The theta value should be chosen based on something that you are trying to test. If not, why use equivalence testing at all?
Charles
Hi, Charles. Thank you very much for all your work. I am trying to perform a TOST test to verify that two instruments measure correctly. I downloaded the Real Statistics Add In to Excel but I can’t find the TOST test. In the Real Statistics window I see these tabs: Desc, Reg, Anova, Time S, Multivar, Corr and Misc. In what tab should I find it? What item of the menu should I look for? Also, could you recommend a link with theory and practical examples regarding the TOST test, so that I can gain more insight and experience? Again, thank you very much for your generous help and support. Have a great day.
Fernando,
You only need to perform a t-test to get the TOST results. This is explained on this webpage.
The t-test is found at the Misc tab.
Charles
Hi Charles,
thanks for your help. I’m trying to understand equivalence test approach better. Why can’t I leave hyp mean diff at 0?
If so, can you tell me how to choose hyp mean diff?
Sonja,
You can set hyp mean equal to zero if you use the approach where you compare the confidence interval with the equivalence interval.
If you prefer to perform two one-tailed tests, then you will need to change the value of hyp mean. This value is set first to the left end of the equivalence interval and then to the right end of the equivalence interval.
Charles
Hi
You say above: Note that if we test the two one-sided null hypotheses directly, we would obtain p-values of .036 and .0013. Since both are less than alpha = .05, we again conclude that the two sources are equivalent (with p-value = .036).
How do you get .036 and .0013? Which test are you using in excel?
Thanks
Hello Sonja,
If you insert the value 25 in cell H5 of Figure 1 you will see that cell H13 changes to .036.
If you insert the value -25 in cell H5, cell H13 changes to .0013.
Charles
That’s perfect.
I’m trying to do the equivalence test using the same test (T Test: Two Independent Samples) and I get following p values:
One Tail: 7.02509E-05
Two Tail: 0.000140502
where hyp mean diff=0 and sig says yes.
What is the conclusion there?
Thanks,
Sonja
You need to specify the equivalence interval and then find the 10% confidence interval from the t-test results.
Charles
What if I leave hyp mean diff at 0? Do p-values above indicate equivalence or there is not enough evidence to make that conclusion?
Thanks
Sonja,
No, this won’t work. You need to follow the approach described on the webpage.
Charles