Unbiased Estimate for CV
In Measures of Variability, we describe the unitless measure of dispersion called the coefficient of variation. It turns out that V = s/x̄ is a biased estimator of the population coefficient of variation σ/μ.
A reasonably unbiased estimate of the population coefficient of variation CV is given by
![]()
where n is the sample size, γ is the population estimate of skewness, and κ is the population estimate of excess kurtosis. For normally distributed data, γ = κ = 0, and so the estimate becomes
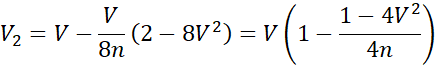
For most purposes, even the estimate
![]()
is reasonably unbiased for normally distributed data.
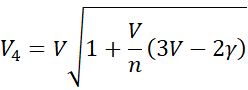
Yet another estimate of the population coefficient of variance is given by the formula
Example
Example 1: Calculate the various unbiased estimates of the population coefficients of variation for the data in range A4:A13 of Figure 1.
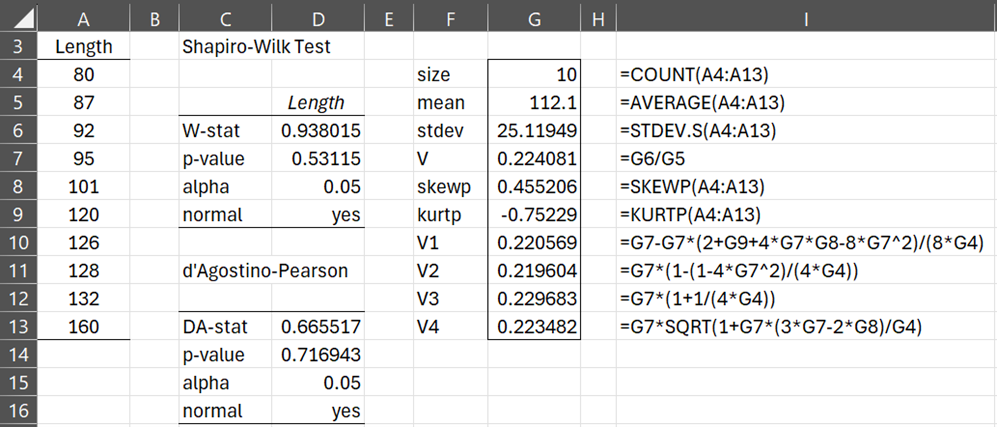
Figure 1 – Unbiased estimates of CV
We see from Figure 1 that the data is normally distributed. The figure also calculates the various estimates of the population coefficient of variation.
Henceforth, we will use V3 as the unbiased estimate of the coefficient of variation.
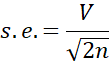
Standard Error
An estimate of the standard error of the population coefficient of variation for normal distributions is given by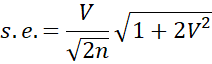 Usually, this is approximated simply as
One-Sample Testing
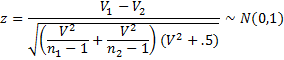
For normally distributed data, you can test whether the population V = V0 by using the following test statistic (two-tailed test).
![]()
where V is the sample coefficient of variation. You can also test whether V ≤ V0 or V ≥ V0 by employing the corresponding one-tailed t-test. The corresponding confidence interval (for the two-tailed test) is
![]()
You can also use other one-sample confidence intervals based on the noncentral t distribution or chi-square distribution. Click here for other estimates of the confidence interval of the coefficient of variation.
Example 2: Determine whether the population coefficient of variation for the data in range A4:A13 of Figure 2 (representing the length of certain biological organisms) is significantly different from 0. Also, find the 95% confidence interval for the population coefficient of variation.
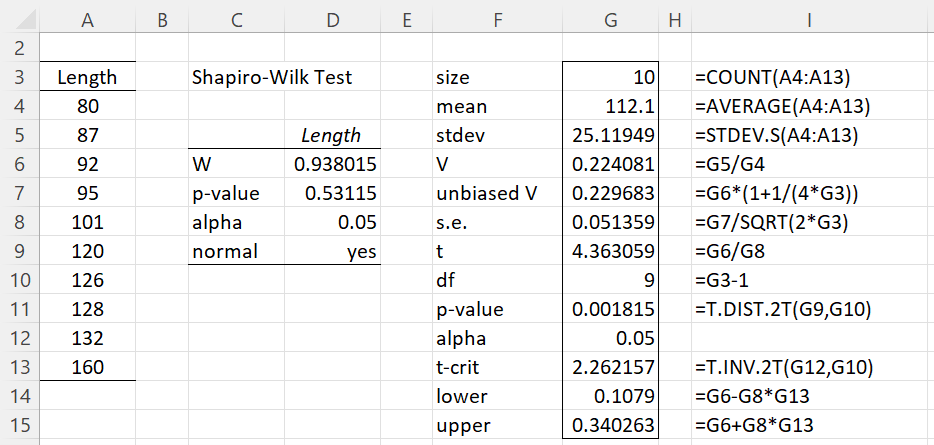
Figure 2 – Test of Coefficient of Variation
We see from the figure that p-value < alpha, and so the coefficient of variation is significantly different from zero. The 95% confidence interval is (.1079, .3403).
Two-Sample Testing
You can also test whether two normally distributed populations with positive means have the same coefficient of variation (i.e. H0: σ1/μ1 = σ2/μ2) based on samples taken from these populations. The test statistic is
where V1 and V2 are the coefficients of variation for the two samples of size n1 and n2, and the pooled coefficient of variation is
![]()
The 1 – α confidence interval for the difference between the population coefficients of variation is
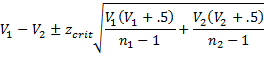
The test works best when the sample sizes are at least 10, and the population coefficients are at most .33.
Example 3: Determine whether there is a significant difference between the population coefficients of variation for weight and height based on the two independent samples in the range A3:B14 of Figure 3. Also, find the 95% confidence interval for the difference between the population coefficients of variation.
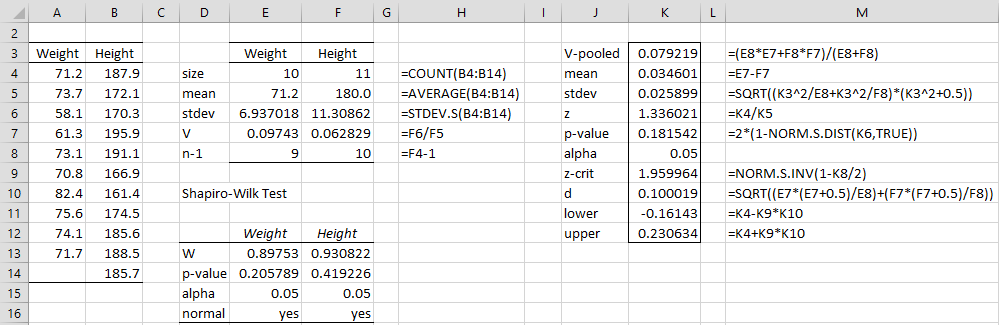
Figure 3 – Two-sample test for the coefficient of variation
As you can see from Figure 3, there is no significant difference between the two coefficients of variation (p-value = .18), and the 95% confidence interval for the difference between the coefficients is (-.1614, .2306).
Real Statistics Support
Real Statistics Functions: The Real Statistics Resource Pack provides the following array functions.
CVTEST(R1, lab, alpha, tails, biased): returns an array with the values from the one-sample coefficient of variation (CV) test on the data in R1: sample CV, unbiased CV, standard error, p-value, lower and upper 1-alpha confidence interval
CV2TEST(R1, R2, lab, alpha): returns an array with the values from the two-sample coefficient of variation (CV) test on the data in R1 and R2: sample 1 CV, sample 2 CV, pooled CV, z-stat, p-value, lower and upper 1-alpha confidence interval
alpha is the significance level of the test (default .05). If lab = TRUE (default FALSE) then a column of labels is appended to the output. For CVTEST, if tails = 2 (default), the two-tailed confidence interval (lower, upper) is returned. If tails = 1, then the two versions of the one-tailed confidence interval are (lower, ∞) and (-∞, upper). Also, if biased = TRUE (default), the unbiased CV (i.e. V3) is used to generate the confidence interval; otherwise, the biased CV (i.e. V) is used.
The output for Example 2 is shown on the left side of Figure 4, as calculated by the array formula =CVTEST(A4:A13,TRUE). The right side of the figure shows the output for Example 3, as calculated by the array formula =CV2TEST(A4:A13,B4:B14,TRUE).

Figure 4 – Real Statistics output
Links
Examples Workbook
Click here to download the Excel workbook with the examples described on this webpage.
References
Halden, J. B. S. (1955) The measurement of variation
https://onlinelibrary.wiley.com/doi/pdf/10.1111/j.1558-5646.1955.tb01559.x
Abdi, H. (2010) Coefficient of variation
https://www.utdallas.edu/~herve/abdi-cv2010-pretty.pdf
Sokal, R. R. and Rohlf, F. J. (1987) Introduction to biostatistics. 2nd Ed. Dover Publications
https://www.stewartschultz.com/statistics/course/Readings/Robert%20R.%20Sokal,%20F.%20James%20Rohlf-Introduction%20to%20Biostatistics_%20Second%20Edition%20(2009).pdf
Liu, S. (2012) Confidence interval estimation for coefficient of variation
https://scholarworks.gsu.edu/server/api/core/bitstreams/23a3df7b-5957-4757-a920-003f372b7f8a/content
Sokal, R. R. and Baumann, C. A. (1980) Significance tests of coefficients of variation and variability profiles
https://academic.oup.com/sysbio/article/29/1/50/1655230
NIST Dataplot (2017) Coefficient of variation confidence limits. National Institute of Standards and Technology
https://www.itl.nist.gov/div898/software/dataplot/refman2/auxillar/coefvari.htm
Verrill, S. (2003) Confidence bounds for normal and lognormal distribution coefficients of variation
https://research.fs.usda.gov/download/treesearch/8938.pdf
Breunig, R. (2000) An almost unbiased estimator of the coefficient of variation
https://ideas.repec.org/a/eee/ecolet/v70y2001i1p15-19.html
Dear Charles, thank you for the great resource.
Throughout the page you talk about normally distributed distribution. Can I do CV2TEST in a non-normally distributed sample? My sample violates the assumption of normality.
Hello Matheus,
This test does assume normality. I don’t know how robust it is to violations of normality.
One approach to dealing with non-normality is to use bootstrapping. The Real Statistics website gives lots of examples as to how this is done. The approach should be similar for the coefficient of variation.
Charles
Dear Charles,
In your formula of Pooled CV, the CV is a mere average of CV1 from group A (With SD1 and V1) and CV2 from group B (with SD2 and V2). The pooled CV should be calculated as follows:
1) First we find pooled variance VP (assuming both groups have the same n): VP = (V1+V2)/2
2) Then we find pooled SD taking a square root from the VP.
3) We calculate the grand mean of both groups – GM
4) We calculate a ratio of pooled SD and GM.
Hello Edita,
Do you have a reference for this approach?
Charles
https://www-users.york.ac.uk/~mb55/meas/cv.htm
Dr. Martin Bland has indicated the “more appropriate” approaches here too: the root mean squared CV and the log methods.
Hello Edita,
Thanks for sharing this article.
Charles
Hi,
I’ve noted that in the explanation for the calculation for the coefficient of variation, you have indicated that you use Vpooled squared in the calculation for the standard error, yet in the Excel calculations you have used Vpooled. Kindly elaborate further.
Thank you for the amazing website, it’s really been a huge help.
Hi Betty,
Glad to hear that the website has been helpful.
Regarding your comment about Vpooled, I assume that you are referring to Figure 2. In that figure, cell K5 refers three times to K3^2 where K3 contains Vpooled. This looks correct to me. Did I make a mistake that I missed?
Charles
Hi,
I have noted the error on my part in my calculations. I apologize. Thank you for the clarification.
Thank you very much Charles, the test for equality of two CVs was very helpful for me. Anyway, I have doubts that the confidence interval for the difference between 2 CV works, as it doesnt follow the standard rule, such that it shouldnt contain zero when the p-value is lower than 0,05. So I suggest the Forkman 2009 approach:
Forkman J (2009) Estimator and tests for common coefficients of variation in normal distributions. Communications in Statistics – Theory and Methods
Tom,
Thanks for alerting me to this approach. I will look into implementing it in one of the next Real Statistics releases.
Charles
That was helpful. Thanks.
Could you please recommend a book to read more about hypothesis testing on the coefficient of variation?
Osako,
There are many choices. Zar’s book could be a good choice. See Bibliography.
Charles
Hello, I am attempting to use the CV2Test function, however, the output is cv1. Any help would be much appreciated.
This is an array function and so you need to modify slightly the approach for using it. See
Array Formulas and Functions
Charles
Charles,
If I want to compare the variability of two samples how would I decide between the CV2TEST and the FTEST? Using the data in Figure 2 the FTEST p=0.157, whereas the CV2TEST p=0.182. I presume the CV2TEST would be more fair since the coefficient of variation is normalized to the mean, which could be very different between samples. Thanks.
Hi Dave,
The result is not very different in this case.
Generally, a t-test (which is equivalent to an F test) is used, but I don’t when it is better to use the CV2TEST.
Charles
Dear Professor,
Thank you for producing such a valuable toolkit!
I encountered an error using the CV2TEST: when the test statistic Z is negative, the p-value results in a number greater than 1.
If you need I can send you an example on which I was working.
Thanks for your attention!
Hi Adriano,
Thanks for bringing this to my attention. Yes, I would appreciate it if you could send me the example that you are working on. You can find my email address at Contact us.
Charles
what is the test used to know the significance of coefficient of variation
The test is described on this webpage, but I don’t know the name of the test. You can probably call it the Coefficient of Variance Test. I got it from Zar’s textbook (see Bibliography).
Charles
Hello Charles, in most introductory Statistics texts, the two sample standard deviation test is addressed almost to the total exclusion of two sample CV test. Which one do you think is better if the data is available ?
Hello Ade,
I have never used the two sample CV test myself and so I don’t really know which is better. The other tests are probably more commonly used and so are easier to defend in research papers.
Charles
dear,
what if the size is less than 10?
How could it be tested?
Hello, I believe there are tables for such tests, but I didn’t think it was important enough to investigate this further.
Charles
Thanks for this info. Can you give us more info on why the test statistic has t distribution? Also why is the standard error of coefficient of variation not V/sqrt(n)?
Emin,
I haven’t investigated this test well enough to give a definitive answer to your questions.
That the t test is used with data that is normally distributed is not surprising since the t test is very related to the normal distribution (as described elsewhere on this website).
To see why the standard error is not V/sqrt(n) you would need to look at the mathematical proofs.
Charles
Hi Charles,
Thanks for the brilliant explanation. I have installed the correct versions on both mac with office 365 and a windows pc with excel 2013. For both I have a check box with the Realstats. However, no icon appears next to the solver in tools. I can type the formulae in, but it just feeds back the letters cv1 in the box. I would be grateful if you could help me figure out what to do?
Ray,
Since you are using an array function, you can’t simply press the Enter key. See the following webpage for how to use an array function:
Array Formulas and Functions
Charles
Dear Charles
Thanks very much for this information. Do you have a data analysis tool for two-sample Cv comparison in the Real Statistics package for Excel, as I can’t seem to find it?
Many thanks as always for your amazing website and code!
Dear Arjun,
Sorry, but I have not yet added this functionality to the software as yet. I expect to add it (probably as a function relatively soon).
Glad that you like the website and software.
Charles
Thanks very much Charles.
BW
Arjun
Arjun,
The next release of the Real Statistics software will contain functions that support the CV tests.
Charles
What is the bibliograhic reference for the formula of one-sample Coefficient of Variation Testing?
Who is the author of this formula?
I appreciate the reference or at least the identification of the author who created the formula.
McKay?
Iglewicz and Myers (1970) ?
José,
If I remember correctly, it cam from Zar, J. H. (2010) Biostatistical analysis 5th Ed. Pearson.
Charles
Can we use the ‘two sample testing’ for more than 2 CVs, for example 6 CVs?
Faizal,
Just like ANOVA is the extension of the t test to more than two samples, you will need an extension of the test given to more than two samples. I am not familiar with such a test, but I have found such a test on the Internet. Here is the link.
https://cran.r-project.org/web/packages/cvequality/vignettes/how_to_test_CVs.html
I have not vetted this approach, and am merely passing it on to you.
Charles
Hi,
In your previous response you mentioned av”reference webpage”. What is the webpage you reference? And, what reference are you using for the tests of significant differences between CV? I’d appreciate more background information.
Thanks!
Elizabeth,
I was referring to the webpage from which the person made his/her comment.
Charles
Would you please tell me what test you have used for two sample testing?
Ignacio,
The test is as described on the referenced webpage. I don’t know what the name of this test is (except maybe “two sample testing of the coefficient of variation”).
Charles