Basic Concepts
We consider a random variable x and a data set S = {x1, x2, …, xn} of size n which contains possible values of x. The data set can represent either the population being studied or a sample drawn from the population. The mean is the statistic used most often to characterize the center of the data in S. We now consider the following commonly used measures of variability of the data around the mean, namely the standard deviation, variance, squared deviation, and average absolute deviation.
In addition, we also explore three other measures of variability that are not linked to the mean, namely the median absolute deviation, range, and interquartile range.
Of these statistics, the variance and standard deviation are most commonly employed.
Worksheet Functions
If R1 contains the data elements in S then the Excel function which calculates each of these statistics is shown in Figure 1. Functions marked with an asterisk are worksheet functions found in the Real Statistics Resource Pack, although equivalent formulas in standard Excel are described later.
| Statistic | Excel 2007 | Excel 2010+ | Symbol |
| Population Variance | VARP(R1) | VAR.P(R1) | σ2 |
| Sample Variance | VAR(R1) | VAR.S(R1) | s2 |
| Population Standard Deviation | STDEVP(R1) | STDEV.P(R1) | σ |
| Sample Standard Deviation | STDEV(R1) | STDEV.S(R1) | s |
| Squared Deviation | DEVSQ(R1) | DEVSQ(R1) | SS |
| Average Absolute Deviation | AVEDEV(R1) | AVEDEV(R1) | AAD |
| Median Absolute Deviation | MAD(R1) * | MAD(R1) * | MAD |
| Range | RNG(R1) * | RNG(R1) * | |
| Inter-quartile Range | IQR(R1, b) * | IQR(R1, b) * | IQR |
| Coefficient of Variation | STDEV(R1)/AVERAGE(R1) | STDEV.S(R1)/AVERAGE(R1) | V |
Figure 1 – Measures of Variability
All these functions ignore any empty or non-numeric cells.
Variance
Definition 1: The variance is a measure of the dispersion of the data around the mean. When S represents a population, the population variance (symbol σ2) is calculated from the population mean µ as follows:
 When S represents a sample, the sample variance (symbol s2) is calculated from the sample mean x̄ as follows:

The reason the expression for the population variance involves division by n while that of the sample variance involves division by n – 1 is explained in Property 3 of Estimators, where division by n–1 is required to obtain an unbiased estimator of the population variance.
Worksheet Functions
Excel Functions: The sample variance is calculated in Excel using the worksheet function VAR.S. We calculate the population variance using the Excel function VAR.P. In versions of Excel before Excel 2010, the equivalent functions are called VAR and VARP.
Example 1: If S = {2, 5, -1, 3, 4, 5, 0, 2} represents a population, then the variance = 4.25.
This is calculated as follows. First, the mean = (2+5-1+3+4+5+0+2)/8 = 2.5. The squared deviation SS (see Definition 3 below) can be calculated as
SS = (2–2.5)2 + (5–2.5)2 + (-1–2.5)2 + (3–2.5)2 + (4–2.5)2 + (5–2.5)2 + (0–2.5)2 + (2–2.5)2 = 34
Thus the variance is SS/n = 34/8 = 4.25.
If instead, S represents a sample, then the mean is still 2.5, but the variance is SS/(n–1) = 34/7 = 4.86.
You can calculate these values in Excel by the formulas VAR.P(B3;B10) and VAR.S(B3:B10), as shown in Figure 2.
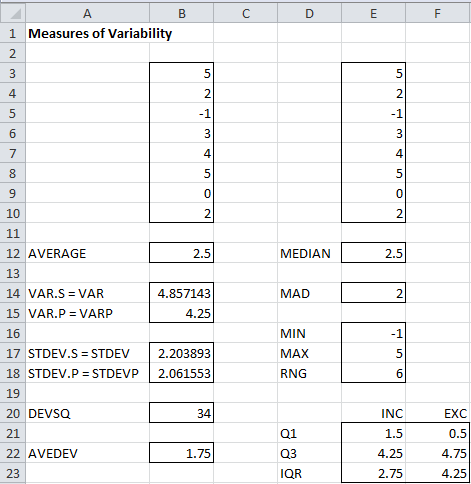
Figure 2 – Examples of measures of variability
Properties
Property 1: If x̄ is the mean of the sample S = {x1, x2, …, xn}, then the sample variance can be expressed by
![]()
Property 2: If µ is the mean of the population S = {x1, x2, …, xn}, then the population variance can be expressed by
![]()
Click here for the proofs of these properties.
These properties are especially useful when data are expressed in the form of frequency tables.
See Weighted Variance for how to calculate the weighted variance.
Standard Deviation
Definition 2: The standard deviation is the square root of the variance. Thus the population and sample standard deviations are calculated respectively as follows:

Excel Function: The sample standard deviation is calculated in Excel using the worksheet function STDEV.S. The population standard deviation is calculated in Excel using the function STDEV.P. For versions of Excel before Excel 2010, the equivalent forms of these functions are STDEV and STDEVP.
Example 2: If S = {2, 5, -1, 3, 4, 5, 0, 2} is a population, then the standard deviation = square root of the population variance = 
If S is a sample, then the sample standard deviation = square root of the sample variance = 
These are the results of the formulas STDEVP(B3:B10) and STDEV(B3:B10), as shown in Figure 2.
Worksheet Functions
Real Statistics Functions: The Real Statistics Resource Pack furnishes the following array functions:
VARCOL(R1) = a row array that contains the sample standard variances of each of the columns in R1
STDEVCOL(R1) = a row array that contains the sample standard deviations of each of the columns in R1
VARROW(R1) = a column array that contains the sample standard variances of each of the rows in R1
STDEVROW(R1) = a column array that contains the sample standard deviations of each of the rows in R1
Example 3: Use the VARCOL and STDEVCOL functions to calculate the sample variance and standard deviation of each of the columns in the range L4:N11 of Figure 3.
The array formula =VARCOL(J4:L11) produces the first result (in range J15:L15), while the array formula =STDEVCOL(J4:L11) produces the second result (in range J16:L16). Remember that after entering either of these formulas you must press Ctrl-Shft-Enter.
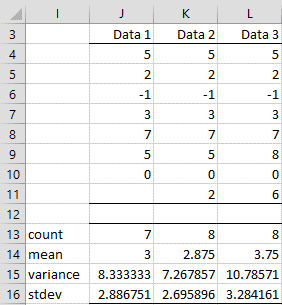
Figure 3 – Sample Variance and Standard Deviation by Column.
See Weighted Variance and Standard Deviation for how to calculate the weighted standard deviation.
Multiple Samples
Example 5: Suppose that you have three samples whose sizes, means, and variance are as shown on the left side of Figure 5. Find the mean and variance of the data set which results from combining the three samples.
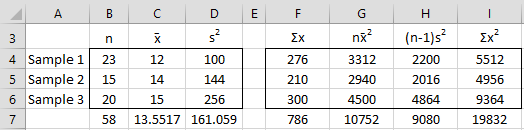
Figure 5 – Calculation of combined mean and variance
We have three samples whose total sample size is 58 (cell B7), calculated via the formula =SUM(B4:B6). The sum of the elements in each sample can be calculated from the mean as shown in range F4:F6. E.g. the sum of all the data elements in sample 1 is 276 (cell F4), calculated via the formula =B4*C4. Thus the sum of all the elements in all three samples is 786 (cell F7), as calculated via the formula =SUM(F4:F6). The mean of the combined sample is therefore 13.5517 (cell C7), as calculated by the formula =F7/B7.
Combined Variance
The calculation of the combined variance is similar. The key is to first find the sum of the squares of all the elements in each sample. These are given in range I4:I6. E.g. the sum of the squares of all the elements in sample 1 is 5512 (cell I4) as calculated by =G4+H4 (using Property 1), where G4 contains the formula =B4*C4^2 and H4 contains =(B4-1)*D4. Thus, the sum of squares of all the elements in the combined sample is 19,832 (cell I7) as calculated by =SUM(I4:I6). Finally, the variance for the combined sample is 161.059 (cell D7) as calculated by the formula =(I7-B7*C7^2)/(B7-1), again based on Property 1. The standard deviation is therefore the square root, namely 12.6909.
Alternative Approach
Note that the mean (cell C7) can also be calculated by the formula
=SUMPRODUCT(B4:B6,C4:C6)/SUM(B4:B6)
and the variance (cell D7) by the formula
=(SUMPRODUCT(B4:B6,C4:C6^2)+SUMPRODUCT(B4:B6-1,D4:D6)-SUM(B4:B6)*C7^2)/(SUM(B4:B6)-1)
Squared Deviation
Definition 3: The squared deviation (symbol SS for the sum of squares) is most often used in ANOVA and related statistical tests. It is calculated by

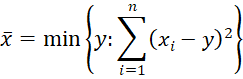
Note that for any set S = {x1, x2, …, xn}, the value y that minimizes the squared deviation is the mean of S.
Excel Function: The squared deviation is calculated in Excel using the worksheet function DEVSQ.
Example 6: If S = {2, 5, -1, 3, 4, 5, 0, 2}, the squared deviation = 34. We get the same result from the formula =DEVSQ(B3:B10) as shown in cell B20 of Figure 2.
Average Absolute Deviation
Definition 4: The average absolute deviation (AAD), aka the mean absolute deviation, of data set S is calculated by
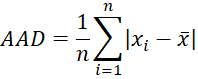
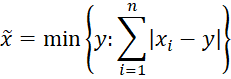
Note that for any set S = {x1, x2, …, xn}, the value y that minimizes the mean absolute deviation is the median x̃ of S.
Excel Function: The average absolute deviation is calculated in Excel using the worksheet function AVEDEV.
Example 7: If S = {2, 5, -1, 3, 4, 5, 0, 2}, the average absolute deviation = 1.75. The formula =AVEDEV(B3:B10) produces the same result, as shown in Figure 2.
Median Absolute Deviation
Definition 5: The median absolute deviation (MAD) of data set S is calculated as
Median {|xi – 
where
MAD is less affected by extremes in the tails of a distribution (i.e. the highest and lowest values in the sample) because data in the tails have less influence on the calculation of the median than they do on the mean. This often makes MAD more suitable as a measure of variability than the variance when the data has outliers (as described in Outliers and Robustness).
Excel Formula: If R1 contains the data elements in S then you can obtain the MAD of S in Excel by using the array formula:
=MEDIAN(ABS(R1-MEDIAN(R1)))
Even though the value is presented in a single cell, you must press Ctrl-Shft-Enter to obtain the correct value. This formula only works properly when R1 doesn’t contain any empty cells or cells with a non-numeric value.
Worksheet Function
Real Statistics Function: Alternatively, you can use the MAD(R1) function which is contained in the Real Statistics Resource Pack. This function works properly even when R1 contains empty cells and/or cells with non-numeric values. You also don’t need to press Ctrl-Shft-Enter to use this function.
Example 8: If S = {2, 5, -1, 3, 4, 5, 0, 2}, the median absolute deviation = 2 since S = {-1, 0, 2, 2, 3, 4, 5, 5}, and so the median of S = (2+3)/2 = 2.5. Thus, MAD = the median of {3.5, 2.5, 0.5, 0.5, 0.5, 1.5, 2.5, 2.5} = {0.5, 0.5, 0.5, 1.5, 2.5, 2.5, 2.5, 3.5}, i.e. (1.5+2.5)/2 = 2.
You can achieve the same result using the Real Statistics formula =MAD(E3:E10) as shown in cell E14 of Figure 2.
Property
The following property provides an indication of the relationship between the standard deviation and MAD.
Property 3: For a normal distribution
σ ≈ 1.4826 ⋅ MAD
Proof: Click here.
Range
Definition 6: The range of a data set S is a crude measure of variability and consists simply of the difference between the largest and smallest values in S.
Excel Formula: If R1 contains the data elements in S then the range of S can be calculated in Excel by the formula:
=MAX(R1) – MIN(R1)
Alternatively, you can use the function RNG(R1) which is contained in the Real Statistics Resource Pack.
Example 9: If S = {2, 5, -1, 3, 4, 5, 0, 2}, the range is 5 – (-1) = 6. You can achieve the same result using the Real Statistics formula =RNG(E3:E10) as shown in Figure 2.
Inter-quartile Range
Definition 7: The inter-quartile range (IQR) of a data set S is equal to the 75% percentile of S minus the 25% percentile of S. The IQR provides a rough approximation of the variability near the center of the data in S.
Excel Formula: If R1 contains the data elements in S then the IQR of S can be calculated in Excel by the formula:
=QUARTILE(R1, 3) – QUARTILE(R1, 1)
Starting with Excel 2010 QUARTILE is relabelled QUARTILE.INC. There is also another version of the quartile function called QUARTILE.EXC. An alternative version of IQR is therefore
=QUARTILE.EXC(R1, 3) – QUARTILE.EXC(R1, 1)
See Ranking Functions in Excel for further information about the QUARTILE and QUARTILE.EXC functions.
Worksheet Function
Real Statistics Function: Alternatively, you can calculate the inter-quartile range by using the IQR(R1, bexc) worksheet function which is contained in the Real Statistics Resource Pack. When bexc = FALSE (default), the version of IQR that uses QUARTILE.INC is returned, while when bexc = TRUE the version that uses QUARTILE.EXC is returned.
Example 10: If S = {2, 5, -1, 3, 4, 5, 0, 2}, then the bexc = FALSE version of IQR = 4.25 – 1.5 = 2.75, while the bexc = TRUE version of IQR = 4.75 – 0.5 = 4.25. You can achieve the same results using the Real Statistics formulas =IQR(B3:B10) and =IQR(B3:B10,TRUE), as shown in Figure 2.
Property
The following property provides an indication of the relationship between the standard deviation and IQR.
Property 4: For a normal distribution
IQR ≈ 1.34898 ⋅ σ
Proof: For a normal distribution
IQR = Q3 – Q1 = NORM.INV(μ,σ,.75) – NORM.INV(μ,σ,.25)
= σ*(NORM.S.INV(.75)+μ) – σ*(NORM.S.INV(.25)+μ)
σ*(NORM.S.INV(.75) – NORM.S.INV(.25)) ≈ 1.34898*σ
Combining the results from Properties 3 and 4, we see that for normally distributed data
IQR = 2 ⋅ MAD
Observation
The variance, standard deviation, average absolute deviation, and median absolute deviation measure both the variability near the center and the variability in the tails of the distribution that represents the data. The average absolute deviation and median absolute deviation do not give undue weight to the tails. On the other hand, the range only uses the two most extreme points and the interquartile range emphasizes the middle portion of the data.
Coefficient of Variation
Definition 8: The coefficient of variation (aka the coefficient of variability or relative standard deviation), V (or CV or RSD), of the data set S is calculated as
V = s/x̄
Since s and x̄ have the same units of measurement, V has no units of measurement. This statistic only makes sense for ratio scale data. The higher the value of V the more dispersion there is.
Clearly, the coefficient of variation is only defined when the mean is not zero.
Excel Formula: If R1 contains the data elements in S then the coefficient of variation for S can be calculated in Excel by the formula:
=STDEV.S(R1)/AVERAGE(R1)
The population version of V is σ/μ which can be calculated in Excel by the formula
=STDEV.P(R1)/AVERAGE(R1)
Examples
Example 11: If S = {2, 5, -1, 3, 4, 5, 0, 2} represents a sample, then, as we can see from Examples 1 and 2, the coefficient of variation is
V = s/x̄ = 2.203892/2.5 = 88.16%
Example 12: Stock A has an expected return of 12% with a standard deviation of 9% and stock B has an expected return of 8% with a standard deviation of 5%. Use the coefficient of variation to determine which is the better investment.
Since VA = .09/.12 = .75 and VB = .05/.08 = .625, stock B is considered to be the better investment since its relative risk (equal to its coefficient of variation) is lower.
Links
Examples Workbook
Click here to download the Excel workbook with the examples described on this webpage.
References
Bhandari, P. (2023) Variability | Calculating range, IQR, variance, standard deviation
https://www.scribbr.com/statistics/variability/
Wikipedia (2012) Median absolute deviation
https://en.wikipedia.org/wiki/Median_absolute_deviation
Is there a excel function or data analysis ToolPk to find standard deviation of random variable directly ?
Many thanks for this useful guide.
I would like to ask about another measure of variability I found reported in several papers. They call it as average successive variability (ASV), which was defined as the average absolute difference between successive values. Clearly, this kind of analysis cannot be done with empty cells. Do you think there is some way to do it automatically in excel?
Hello Marco,
Assuming that the data is stored in say the range A1:A100, you can calculate the ASV using the array formula =AVERAGE(ABS(A1:A99-A2:A100)).
This is an array formula and so you must press Ctrl-Shft-Enter and not just Enter.
Charles
Charles,
When I use =VAR.S on the data set {2,5,-1,3,4,5,0,2) I get 4.85714286 instead of 2.203892 in example 11. Why might this be the case?
Thanks
Hello Ian,
The problem is that you should use STDEV.S instead of VAR.S. This is not correctly stated on the webpage. Thank you for detecting this inconsistency. I have now corrected the error on the webpage. I appreciate your help in improving the accuracy of the website.
Charles
Sir,
I am trying to use the MAD function with currency values, but it doesn’t seem to like that. It took me an hour to think of that possibility and change the number format. Is there something I can do to make this function work with the currency format?
Thank you.
Christopher
Christopher,
I just tried using the MAD function on data that is in currency format, and it worked perfectly. If you send me an Excel file with your data, I will try to figure out what is going wrong.
Charles
Charles,
It seems that I am not able to take advantage of any functions Real Statistics has. This does not seems to be limited to =VARCOL() as I initially asked. I was testing RNG function in Ex 9. The value returned as #Name?. I am afraid that I would come across the same value for other customized functions.
Let me explain how I downloaded and installed the Real Statistics Resource Pack :
1. Downloaded from the web.
2. Saved the file into the recommended directory under Microsoft/AddIns
3. Confirmed that the Solver Add-in box has been selected.
4. Selected Analysis ToolPak and Analysis ToolPk-VBA
5. Selected Realstats.
Any steps I missed and did wrogn?
-Sun
Sun,
The list of actions looks correct (except that item #4 is not necessary), assuming that “selected” means that you put a check mark next to it in the list of addins.
In any case, something must be wrong since the #NAME? value indicates that the Real Statistics software was not installed.
Charles
Charles,
I deleted and reloaded without step #4. Now, it works.
Thank you!
-Sun
Sun,
Good to hear.
Charles
Charles,
I have a problem producing the same results using the formula VARCOL as you explained. I placed the cursor on the cell J15 and typed the formula with the range specified in Example 3 with Ctl+Shft+Enter closing. The answer came back with #Name?. I checked “AddIn” to ensure that real stat is available in my computer.
Sun Kim,
The VARCOL function is working correctly on my computer. What do you see when you enter the formula =VER() on your computer?
Charles
Did you mean =VAR()? If I choose only one column, then I have the correct variance as you have in the example. But if I choose more than one column (ie, =VARCOL()) , then it came back with an error value (ie, #Name?)
When I entered the function, should I choose all 3 cells in the row where these variances are to put listed? I did both chose one cell (under the first intended column) and three cells (under the 3 intended columns). Both came back with #Name?.
Sun,
No, I meant the =VER() formula.
See other email response.
Charles
Dear Charles
Thanks so much for the useful website.
I have a question about the AAD. I used to write the formula SUMPRODUCT(ABS(VALUES))/n * 100 based on the AAD equation to find the absolute average values. But it gives a different value with the command AVEDEV(R). So is that my formula wrong to calculate the AAD?
Another thing is that I want to ask how to find maximum deviation (MD) using excel?
Yours Sincerely
Xue
Xue,
AAD is not the average of the absolute values of the data elements. Instead it is the average of the absolute deviations from the mean.
Thus, AAD can be calculated by =SUMPRODUCT(ABS(R-AVERAGE(R)))/COUNT(R).
The maximum deviation is =MAX(ABS(R-AVERAGE(R)))
Charles
Dear Charles
Firstly thanks for the great website.
I have a general question that has plagued me for a long time and I have yet to receive a satisfactory answer: why is so much of statistics based on standard deviation rather than average absolute deviation?
Prima facie the latter seems to be the more natural measure of variation from the mean? The calculation of variance and subsequently SD seem, to me at least, to involve the squaring of deviation scores with the sole purpose of obtaining an average absolute measure of variation from the mean, which the calculation of average absolute deviation itself does not require.
I’m genuinely interested in understanding the principles behind this.
Best regards
Gerhard
Gerhard,
I can think of two reasons why SD is used more often than AAD:
1. SD penalizes larger departures from the mean more than AAD.
2. The mathematics is easier
Charles
Thanks Charles
From what I had read those two appeared to me to be the most intuitive reasons, particularly the penal weighting given to outliers.
It had always just seemed a bit arbitrary to me to square the deviation scores, and I guess I was hoping that there may be a more fundamental reason, e.g. that SD is a component of the normal distribution function and the ND function seems to be fundamentlal ‘law’ of the universe… would that be fair to say; or could one express the ND function in terms of AAD?
I realise this is something of a redundant question as SD is what is widely used and this isn’t going to change, but thanks in advance for your insight!
Best
Gerhard
Gerhard,
One of the problems with the SD approach is the presence of outliers. It is one thing to penalize larger departures from the mean, but this penalty tends to be too high when outliers are present. In fact, AAD is often used when outliers are present.
Probably ND is a fundamental ‘law’ of the universe because of the Central Limit Theorem which relates all sampling distributions (at least for large enough samples) to the normal distribution.
It is interesting to note that LAD regression is based on AAD instead of SD, but the approach used is based on an iterative approximation of ordinary regression (based on SD), as explained on the webpage https://real-statistics.com/multiple-regression/lad-regression/
Charles
Charles, I’m performing some analysis on the feedback received from a survey using a Likert scale with a range of 1 to 5. Population size is 8 and there were 14 questions. I am getting Variances of 1.14 to 0.29 across the 14 questions responded. At what variance point should I say that the results are not significant (e.g. 2.5; meaning there is so much variability in the responses that the result would not e statistically significant)?
Manuel,
I don’t understand what you mean by “the results are not significant”. Do you mean that the variances are significantly different? If so, you can use Levene’s test. See
Homogeneity of Variances
Charles
Is Average Absolute Deviance the same as Average Real Variability? if so could you explain how this is calculated. I have a series of ambulatory blood pressure measurements and if you could use the following measurements as an example that would help greatly!
138, 130, 125, 120, 130, 140, 135, 145
Paul,
Average Real Variability (ARV) is not the same as Average Absolute Deviance. In fact am have never heard of ARV before. In any case, the following gives a formula for calculating ARV which you might find useful.
https://www.ncbi.nlm.nih.gov/pmc/articles/PMC3848629/
Charles
Dear Mr Zaiontz,
In my experience many authors define the sample variance ( and by extension the SD ) using the same formula as the population variance i.e division by n not n-1, and state that with large samples ( greater than 30) this sample variance will give a good approximation to the population variance.
They then explained that when samples fall below 30 it is necessary to adjust the sample deviation using Bessell’s correction (multiplying the sample variance by n/(n-1) ) to obtain an unbiased or ‘best estimate’ of the population variance.
Applying n/(n-1) is the same as using n-1 as the denominator, as you have when above when defining the sample variance. However, these authors see a clear difference between the sample variance ( defined in the same way as pop. variance) and an adjusted sample variance to reduce bias ( using n-1), and use different symbols to distinguish between them. Why this matters is that I have seen identical problems based on ‘the sample SD’ treated differently because one author uses the n definition and expects a correction factor to be applied while another uses your definition and hence treats the SD as having been adjusted.
Respectfully,
Michael
Dear Mr. Zaiontz,
I have a question regarding to the IQR example.
First, This is how I calculate the IQR for the data set
given S = {2, 5, -1, 3, 4, 5, 0, 2}
-(1)- reorder: -1, 0, 2, 2, 3, 4, 5, 5
-(2)- median: -1, 0, 2, 2 | 2.5 | 3, 4, 5, 5
-(3)- Q1 as median of {-1, 0, 2, 2} = (0+ 2)/2 = 1
-(4)- Q3 as median of {3, 4, 5, 5} = (4 + 5)/2 = 4.5
-(5)- IQR = Q3 – Q1 = 4.5 – 1 = 3.5
As you can see, the result is totally different with the two versions of IQR calculated using Excel function QUARTILE.EXC (IQR = 4.75 – 0.5 = 4.25) and QUARTILE.INC (IQR = 4.25 – 1.5 = 2.75).
My questions are:
– Which IQR result should I rely on?
——————————————
For people who is curious about why there is a difference in calculation between QUARTILE.EXC and QUARTILE.INC, this article:
http://datapigtechnologies.com/blog/index.php/why-excel-has-multiple-quartile-functions-and-how-to-replicate-the-quartiles-from-r-and-other-statistical-packages/ gives a good explanation.
Dear Mr. Zaiontz,
There is a typo in example 12, on the calculation of VB.
It should be VB =.05/.08 not .5/.08
Thanks.
Le,
Thanks for catching this typo. I have just corrected the mistake.
I appreciate your diligence and help in improving the website.
Charles
Le,
As the article you referenced explains there is no one right answer. The consensus seems to be that it is better to use QUARTILE.EXC though.
Charles
Hi, Charles,
In the Coefficient of Variation section, you said that V = S/x_bar.
S is variance, right? Then how come it has the same unit as the average x_bar?
You said that coefficient of variation only works with ratio data. For ratio data, can we also use standard deviation to measure variability? What’s the difference between the variation coefficient and SD in this case?
Thanks!
Xiaobin,
S stands for standard deviation (not variance). This is why the units are the same.
You can certainly use the standard deviation to measure variability (which is why it is one of the statistics described on the referenced webpage).
The coefficient of variation is the standard deviation divided by the mean.
Charles
Dear Dr Zaiontz,
I’m trying to analyze summary survey data that used a 6 point Likert-type scale (where 1=strongly disagree and 6=strongly agree). I’ve done some of the basic summary stats, but I would like to calculate variance/standard deviation but all my data are in summary form instead of all the examples I’ve seen elsewhere that list each individual response. So for example: for question 1, I have 1 row of data: 50 people chose strongly agree, 11 agree, 4 somewhat agree, and 0 chose somewhat disagree, disagree, or strongly disagree, for a total of 65 responses. I’ve calculated a mean summary score (5.7076) but is there a way to use the stats functions in Excel to calculate SD without manually expanding all the data to be in a format showing each individual response? I’m still pretty new at this so would really appreciate any advice – thanks!!
Jennifer,
Essentially you have a frequency table. You can calculate both the mean and variance via a weighted sum, which in Excel is implemented using the SUMPRODUCT function. This is shown in Figure 4 of the following webpage:
https://real-statistics.com/real-statistics-environment/data-conversion/frequency-table-conversion/
For your specific data the variance is .335 as described using two methods in the following image (the standard deviation is the square root): Click here for the image
Charles
I see – thank you so much for the help!!
Hi Charles, I’m having trouble getting MAD to work with an array. Specifically, I have a few groups (Group 1,2,3 in column C) with different values for some variableA in column D. There are different numbers of members in each group (max is specified below with ####), but each group is clustered together in sequence, i.e., the order in the spreadsheet is always 1,1,2,3, not 1,3,2,1. I want to compute MAD in Column B of variableA for Groups 1,2,3 with a formula that relative references the name “1”, “2”, or “3”. Column A is the list of these groups that will be relative referenced: 1 is in A1, 2 is in A2, 3 is in A3.
This is what I’ve got:
B1= {=mad(IF(C$1:C$####=A1,D$1:D$####))}
the formula works for the first entry A1, but not A2:A#### if it’s not an array formula. But if it is, then something that’s clearly not the MAD returns (expected MAD is about 0.01 for the dataset but when the formula is entered as an array it returns a value >5.0). Do you have any insight?
Error in:
the formula works for the first entry A1, but not A2:A#### if it’s not an array formula.
Should read:
the formula works for the first entry A1, but not A2:A3, if it’s not an array formula.
Radek,
Suppose I have the following data in range A1:B6:
1 45
2 56
1 78
2 23
1 45
1 25
The array formula =MAD(IF($A$1:$A$6=1,$B$1:$B$6,””)) will yield the result of 10, but you must press Ctrl-Shft-Enter to get this result.
Charles
How do i compare 2 distributions using median absolute deviation ?
Sindhuja,
You can certainly calculate the MAD for each distribution and look at the ratio between the two. don’t know of an analytic test to determine whether there is a significant difference between the two, but you can certainly use one of the resampling techniques described on the website.
Charles
Dear Dr. Charles,
How to calculate robust standard deviation By Q method (as per DIN 38402 – A45:9/2003 and ISO/TS 20612:2007 respectively. Can you explain with simple example?
Regards.
A.Dasgupta.
Assuming that you are referring to robust standard errors, please see the following webpage
Robust Standard Errors
Charles
Dear Dr Charles,
Many thanks for your immediate response. It seems Q method is very similar to Qn method of Std Dev as given in ISO 13528 ( based first quartile of successive difference in reading and correction factor), but not exactly same.
Regards.
A.Dasgupta.
Sorry, but the only robust standard error approaches I can explain are the ones that appear in the website.
Chatles
Dear Mr. Zaiontz,
How would one go about calculating the Mean Average Deviation of two combined samples utilizing only the summary statistics of the two individual samples (something analogous to Property #4 above as opposed to having to combine the two samples and then re-compute these statistics for the new, combined sample). Or, is there a way to compute a “correlation factor” of some kind using Mean Average Deviations instead of Variances?
Keith,
What is your definition of mean average deviation? Are you referring to median average deviation, mean absolute deviation or some other statistic that can be abbreviated MAD?
I also don’t know what you mean by “correlation factor”?
Charles
Dear Charles Zaiontz,
I am investigating the ratio of two means, let’s say X:Y (as this is a measure of plant leaf dry content). Is there anyway I can combine their standard deviations?
X is 27 (an average from 20, 28, 33) (leaf dry weight)
Y is 156 (an average from 113, 168, 188) (leaf fresh weight)
I am interested in the ratio which is 0.17
St.dev. of X is 5.35
St.dev. of Y is 31.71
Can I calculate a St.dev. for the ratio 0.17?
Kindest regards,
Ditte
Hello Ditte,
First of all, you have two methods of estimating the population mean. The first is the approach you used, namely 27/57. The second is to take the mean of 20/113, 28/168, 33/188. These won’t necessarily be the same. Regarding standard deviations, see the following webpage:
http://www.stat.smu.edu/~hseltman/files/ratio.pdf
Charles
sir,
i have a data sample of 50 with 8 variables of comfort factors affect to the public transit,
those data is in likert scale format,
sir, i wanted to analyse those data with mean, std deviation and variation, and also to do regression analysis
please help me to find it (method) ASAP
thank you!
Dilan,
Sorry, but I don’t understand your question. What do you mean by “analyse those data”? You can calculate the mean, standard deviation and variance (e.g. by using the Excel functions AVERAGE, STDEV and VAR). You can perform regression as described on the Real Statistics website (insert Regression in the Search box).
Charles
Dr. Charles,
I think he has got some ordinal data as he says “those data is in likert scale format”. Is it ok to say “You can calculate the mean, standard deviation and variance (e.g. by using the Excel functions AVERAGE, STDEV and VAR).”?
You can only calculate the mean, standard deviation, etc. if you interpret Likert data as interval data, i.e. the distance between 1 and 2 is the same as between 2 and 3, 3 and 4, and 4 and 5 (assuming as 1,2,3,4,5 scale). In this case you can use the Excel functions.
Charles
Dr. Zaiontz,
Wow, thanks for the quick reply! That definitely worked perfectly, I checked it inductively at first, then deductively to prove it and if I did everything right, your method is exactly what I wanted. Thank you so much!
Immeasurable thanks,
Cave