Basic Concepts
Divergence is a measure of the difference between two probability distributions. Often, this is used to determine the difference between a sample and a known probability distribution.
Divergence takes a non-negative value. The value is zero when the two probability distributions are equal.
We consider two measurements of divergence here.
Kullback-Leibler Divergence (KL)
Given two finite distributions p and q with corresponding elements x1, …, xn and y1, …, yn
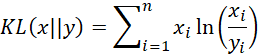
We assume that when yi = 0, then xi = 0, and in this case, we set ln(xi/yi) = 0. Note too that it is assumed that the elements x1, …, xn and y1, …, yn are the values of a discrete probability distribution, and so each must sum to one. Thus, you may need to replace each xi by xi/
We can also use the terminology KL(p||q) where p is the pdf whose values are x1, …, xn and q is the pdf whose values are y1, …, yn. We can view KL(p||q) as representing the information gained by using p instead of q. From a Bayesian perspective, it measures the information gained when revising your prior beliefs from p to the posterior distribution q.
Note that KL(x||y) and KL(y||x) are not necessarily equal. The natural log can be replaced by a log of base 2.
Jensen-Shannon Divergence (JS)
Given two finite distributions p and q with corresponding elements x1, …, xn and y1, …, yn

where zi = (xi+yi)/2. For this measure of divergence JS(x,y) = JS(y,x).
Examples
Example 1: Determine how well the discrete distribution displayed in column C of Figure 1 approximates the binomial distribution with n = 3 and p = .4.
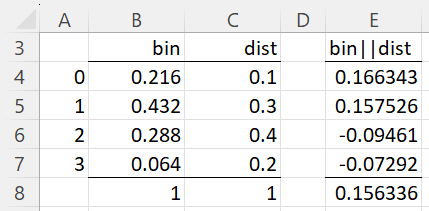
Figure 1 – Kulback-Leibler divergence
The binomial distribution elements are shown in column B. E.g. cell B4 contains the formula =BINOM.DIST(A4,3,0.4,FALSE). We next insert the formula =B4*LN(B4/C4) in cell E4, highlight range E4:E7, and then press Ctrl-D. We calculate the Kulback-Leibler measure of divergence by placing the formula =SUM(E4:E7) in cell E8.
Example 2: Calculate the Jensen-Shannon divergence for the distributions from Example 1.
We first calculate the mean distribution as shown in column D of Figure 2. We then calculate KL(bin||mean) and KL(dist||mean) as shown in cells F8 and H8. Finally, JS(bin, dist) is the mean of these two values, namely .039847, as shown in cell J8.
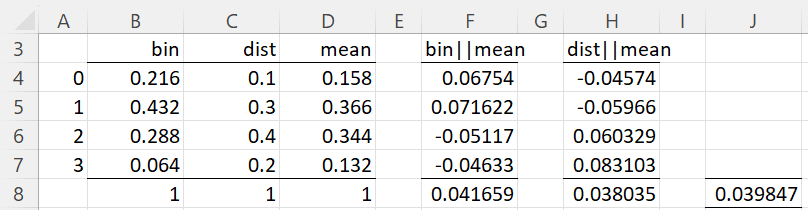
Figure 2 – Jensen-Shannon divergence
Worksheet Functions
Real Statistics Functions: The Real Statistics Resource Pack provides the following worksheet functions where R1 and R2 are column arrays with the same number of rows.
KL_DIVERGE(R1, R2) = Kullback-Leibler divergence for R1 || R2
JS_DIVERGE(R1, R2) = Jenson-Shannon divergence for R1 and R2
E.g. the KL divergence measure for Example 1 can be calculated via the formula =KL_DIVERGE(B4:B7,C4:C7). Similarly, we can calculate the JD divergence measure for Example 2 via the formula =JS_DIVERGE(B4:B7,C4:C7).
Credit scoring divergence
There is also another measure of divergence which is used for credit scoring. Click here for more information about this type of divergence.
Links
Examples Workbook
Click here to download the Excel workbook with the examples described on this webpage.
References
Wikipedia (2023) Divergence (statistics)
https://en.wikipedia.org/wiki/Divergence_(statistics)
Brownlee, J. (2019) How to calculate the KL divergence for machine learning. Machine Learning Mastery
https://machinelearningmastery.com/divergence-between-probability-distributions/
Wikipedia (2023) Kulback-Leibler divergence
https://en.wikipedia.org/wiki/Kullback%E2%80%93Leibler_divergence