Basic Concepts
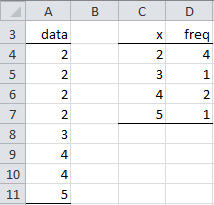
Often data is presented in the form of a frequency table. For example, the data in range A4:A11 of Figure 1 can be expressed by the frequency table in range C4:D7.
Figure 1 – Frequency Table
The table in Figure 1 shows that the data element 2 occurs 4 times, the element 4 occurs 2 times and the elements 3 and 5 occur 1 time.
When data is provided in the form of a frequency table, the calculation of the mean and standard deviation cannot be performed directly using the usual AVERAGE and STDEV Excel functions. For sample data {x1, …, xm} with corresponding frequency counts of f1, …, fm respectively and sample size n = f1 + f2 + … + fm, based on the definition of the sample mean (see Measures of Central Tendency), we see that

Descriptive Statistics in Excel
We can calculate the sample mean in Excel by using the formula
=SUMPRODUCT(R1, R2) / SUM(R2)
where R1 is an array containing the data elements {x1, …, xm} and R2 is an array containing the frequencies {f1, …, fm}.
Similarly, the sample variance can be expressed as
which can be calculated in Excel by the formula
=SUMPRODUCT((R1-R3)^2, R2)/(SUM(R2)-1)
where R1 and R2 are as above and R3 is a cell that contains the sample mean (as described above). Using Property 1 of Measures of Variability, we also have the following alternative approach to calculating the variance:
which can be calculated in Excel by the formula
=(SUMPRODUCT(R1^2,R2)-SUM(R2)*R3^2)/(SUM(R2)-1)
Using these formulas we can calculate the mean and variance of sample data expressed in the form of a frequency table. We demonstrate this in the following example.
See Descriptive Statistics for Frequency Tables for information about calculating additional descriptive statistics for the data represented by a frequency table.
Simple Example
Example 1: Calculate the mean and variance of the sample data from the frequency table in Figure 1.
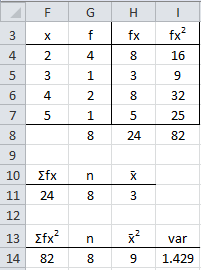
Figure 2 – Calculation of mean and variance from frequency table
Figure 2 displays the necessary calculations. Here cell F11 contains the formula =D11/E11, which calculates the mean. Cell G14 contains the formula =(D14-E14*F14)/(E14-1), which calculates the variance. The results are the same as calculating the mean and variance by applying the formulas AVERAGE(A4:A11) and VAR.S(A4:A11), with reference to the cells in Figure 1.
Note too that a frequency table is closely linked to a frequency function, as defined in Definition 1 of Discrete Distributions. E.g. since there are 8 elements in the data set in Figure 2, we see that the frequency function for the random variable x is as shown in Figure 3 where each frequency value is divided by 8:
Figure 3 – Frequency function corresponding to frequency table
Example based on intervals
Often frequency tables are used with a range of data values, i.e. with intervals for the x values. In this case, the midpoint of each interval is assigned the value xi.
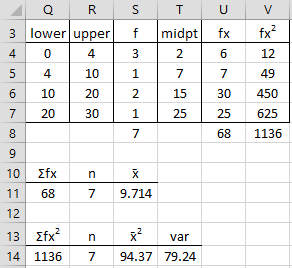
Example 2: Calculate the mean and variance for the data in the frequency table in Figure 4.
Figure 4 – Calculations for a frequency table with intervals
The first interval in Figure 4 is 0 < x ≤ 4, the second 4 < x ≤ 10, etc. Figure 2 shows how to calculate the mean and variance, except that now the midpoint of each interval is used as the value. The result is that the mean is 9.714 (cell S11) and the variance is 79.24 (cell T14).
Observation: Sometimes the first and/or last interval is unbounded: e.g. suppose the last interval in Figure 4 is replaced by “over 20”. In this case, it isn’t possible to establish a midpoint. As a result, all you can do is make your best estimate of a suitable representative value for that interval.
Worksheet Function
Excel Function: When you have a lot of data, it is convenient to put the data in bins, usually of equal size, and then create a graph of the number of data elements in each bin. Excel provides the FREQUENCY(R1, R2) array function for doing this, where R1 = the input array and R2 = the bin array.
To use the FREQUENCY array function, enter the data into the worksheet and then enter a bin array. The bin array defines the intervals that make up the bins. E.g., if the bin array = 10, 20, 30, then there are 4 bins, namely data with values of x ≤ 10, data with values of x where 10 < x ≤ 20, data with values of x where 20 < x ≤ 30, and finally data with values of x > 30. The FREQUENCY function simply returns an array consisting of the number of data elements in each of the bins.
Example using FREQUENCY function
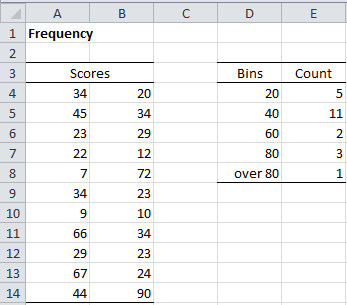
Example 3: Create a frequency table for the 22 data elements in the range A4:B14 of Figure 5 based on the bin array D4:D7 (the text “over 20” in cell D8 is not part of the bin array).
Figure 5 – Example of the FREQUENCY function
To produce the output, highlight the range E4:E8 (i.e. a column range with one more cell than the number of bins) and enter the formula
=FREQUENCY(A4:B11,D4:D7)
Since this is an array formula, you must press Ctrl-Shft-Enter. Excel now inserts frequency values in the highlighted range E4:E8. Here E4 contains the number of data elements in the input range with the value in the first bin (i.e. the number of data elements whose value is ≤ 20). Similarly, E5 contains the number of data elements in the input range with a value in the second bin (i.e. data elements whose value is > 20 and ≤ 40). The final output cell (E8) contains the number of data elements in the input range whose value is greater than the value of the last bin (i.e. > 80 for this example).
Real Statistics Function
As described in Discrete Probability Distributions, the Real Statistics Resource Pack provides the FREQTABLE function. This function can also be used to create a frequency table with equally spaced bins.
Real Statistics Function: The Real Statistics Resource Pack supplies the following array function to create a frequency table
FREQTABLE(R1, bsize. bmax) = an array function that produces the frequency table for the data in R1, assuming equally sized bins of size bsize where bmax is the maximum bin size value
To use the function you must highlight an array with 3 columns and at least k rows where k = (bmax – MIN(R1)) / bsize + 1. You can highlight more rows than you need; any extra rows will take the value #N/A.
The bmax argument is optional. If omitted then it defaults to bmax = MAX(R1). When bmax is not omitted then you should make sure that bmax ≥ MAX(R1): otherwise some data will be lost.
The bsize argument is also optional. If omitted then instead of creating a frequency table as described here, a table with a bin for each value in R1 is used. The bmax argument is ignored. This produces a table similar to that described in Example 3 of Discrete Distributions.
Example using the FREQTABLE function
Example 4: Create a frequency table for the 22 data elements in range A4:B14 of Figure 5 based on bins of size 15.
The desired frequency table can be produced using the array formula
=FREQTABLE(A4:B14,15)
as shown in range M4:O11 of Figure 6.
Figure 6 – FREQTABLE function with bin size 15
The headings have not been output by the function but have been added manually. Note that two extra rows have been highlighted; any extra rows will take the value #N/A.
Data Analysis Tools
You can also use Real Statistics’ Histogram with Normal Curve Overlay data analysis tool to create a frequency table. See Histograms for an example of how to use this data analysis tool.
Also, see Descriptive Statistics for Frequency Tables for a description of the Real Statistics data analysis tool that outputs descriptive statistics for the data represented by a frequency table.
Data Conversion
See Frequency Table Conversion for a description of how to convert data in a frequency table to raw data format and vice versa.
Examples Workbook
Click here to download the Excel workbook with the examples described on this webpage.
Reference
Microsoft Support (2012) FREQUENCY function
https://support.microsoft.com/en-us/office/frequency-function-44e3be2b-eca0-42cd-a3f7-fd9ea898fdb9#:~:text=The%20FREQUENCY%20function%20calculates%20how,entered%20as%20an%20array%20formula.


Hi!
Thanks, very helpful. I had a question. In the sample variance formula, why is there a -1:
=SUMPRODUCT((R1-R3)^2, R2)/(SUM(R2)-1)
What role does that play? Also, I am getting a few negative variances, which seems counter-intuitive. How do I interpret these results?
Thank you.
Hello Charles. How I can figure out a probability based on the information about SD, mean, frequency data?
Hello Ivan,
If you have the frequency data, you can calculate the probabilities by dividing by the sample size.
In general, you can’t calculate the probabilities if you just know the mean and standard deviation. You also need to know the distribution. E.g. if you also know that the data is normally distributed with mean m and standard deviation s, then for any x you can calculate the probability of x.
Charles
Charles, it’s me again) could you please give me a link where I can find information about how distribution influence on a probability?
Hello Ivan,
See Probability Distributions
Charles
Hey Charles,
Really appreciate your explanation here and the work you put in.
using the =FREQUENCY function in excel, how would you calculate the frequency for a scenario where I want to see the average frequency each string appears in the array below (large dataset)?
Data:
Column1
String 1234
String 1234
String 4567
String 4567
String 4567
String 4567
String 8910
Expected Output:
Column1|Column2
String 1234 | 2
String 4567 | 4
String 8910 | 1
Then the goal would also be to average all of Column2 to get the average frequency.
Please let me know your thoughts if you could.
Hello Martin,
Suppose that the data is found in range A1:B40 and there are 20 unique strings in column A. Place the Real Statistics array formula =SortUnique(A1:A40,””) in range D1:D20. Then place the formula =AVERAGEIF(A$1:A$40,D1,B$1:B$40) in cell E1, highlight the range E1:E20 and press Ctrl-D. If I understand what you are looking for, I think this should work.
Charles
Hello, please help me out. its urgent
take a look at the data below, and answer the question below the data
Index No. January February March
1123Q 27 81 81
1124Q 55 61 63
11240 72 63 33
11245Q 42 14 42
11246Q 63 81 55
1245Q 73 78 72
Use an appropriate function/formula to find the frequency of the number 55, 63, 72, 81
Hello Meshach,
I don’t understand your question. Are you looking for an Excel formula? If so this is described on this webpage.
Charles
Charles,
In Example 3, when I used the FREQTABLE with bin size=20 to reproduce the same frequency table in the example, my bin started at 10 and then 30, 50, … instead of starting at 20. Should the initial bin start at 20 instead of 10 with the bin size =20?
Sun Kim,
When using the FREQTABLE function you specify the maximum not the minimum value. Thus, to obtain the same result, use the following array formula:
=FREQTABLE(A4:B14,20,100)
Charles
Hi,
Prof Charles please can you teach me how to find the mid-point and the deviation on the frequency table.Thank you
Hi,
I need a calculation with time for scheduling. For example –
I have 16 buses and make a departure with a frequency of 4/8
Route Length 6 Km
Time per Km 5 minutes
=6*5/16
=4/8
Sorry, but I don’t understand your question.
Charles
Hello, Charles: Thanks again for your work here.
With regard to frequency tables, what test is there to compare two frequencies, say Freq A versus Freq B?
x fA fB
0 77 2
1 36 50
2 8 42
3 4 12
4 1 10
Thanks and best regards!
John
John,
A frequency table is just a compact way of specifying a data set. Thus, any test you can use on a pair of samples you can apply to two frequency tables (t tests, Mann-Whitney test, Kolmogorov-Smirnov, etc.). You need to decide what sort of comparison you want to make (comparing the distributions, comparing means, comparing medians, etc.).
Charles
IF ((CountOfItems <= 100)) THEN
intervalCenter = (MAX – MIN) / (1 + 3.32 * log10(CountOfItems))
ELSE
intervalCenter = (MAX – MIN)) / (5 * log10(CountOfItems));
nextCenter = MIN + (intervalCenter/ 2);
DO
….
nextCenter = nextCenter + intervalCenter
WHILE nextCenter < MAX
Following Example 3:
Data = [34,45,23,22,7,34,9,66,29,67,44,20,34,29,12,72,23,10,34,23,24,90]
Interval Centers (Bins) & Frequencies (Count) looks ~ the same:
[
[14.605129507291] => 4
[29.815388521873] => 8
[45.025647536454] => 6
[75.446165565618] => 3
[90.656424580199] => 1
]
Nauris,
Are you sharing some information with the community or do you have a question?
Charles
Hi, Charles
Thanks for post.
Just sharing info/formula (and results) how to calculate intervals for frequency table (asked by Prashanth)
In figure 2 are you calculating the variance and not the standard deviation as the caption states?
Paul,
Yes, it is the variance. I have changed the caption.
Charles
Hello,
When I use the histogram or frequency function, one of my values is being counted outside of the maximum value of my bin. The final bin goes from 6.36 to 6.64 and there are 3 values that should be counted here: 6.46, 6.64, and 6.64. However, in the ‘More’ row of the Data Analysis Histogram function there is a 1 and only a 2 in the 6.64 bin. This is also happening when I used the Frequency function, with 2 values being counted and the other one left out altogether. What am I missing here? How do I get the function to count all 3 of the values? Thanks!
Shawnda,
This probably has something to do with how these decimal numbers are being rounded off, but if you send me an Excel file with your data and results, I will try to figure out what is going on. You can find my email address at Contact Us.
Charles
Hey Charles,
Nice work. I keep visiting your page and updating the add-in for 2 years now. What should I say… luckily the days of Holt-Winters templates are over.
However, one thing I came across that I miss in Excel native functions or your FREQTABLE function is that I cannot (or do not know how to) make BINS that include the lower bound and exclude the upper bound.
This is relevant for me when I make an analysis of elapsed time/age/ difference between two time stamps. Consider the case of people and their birthdate listed. If you make BINS of 12 months like in Excel: ]0,12] (0 years old); ]12,24] (1 year old); ]24,36] (2 years old) etc. you’ll end up in trouble since the day on which one’s birthday is, makes a year complete and starts a new year. Humans actually add a year of life on their birthday, not the day after their birthday.
If a person is aged 24 months (s/)he’s actually in my 1 year old BIN which is wrong because he/she just has his/her birthday. The day after, (s/)he’ll be 24,x months old and (s/)he joins the 2 year old group only then. Since humans count their age from the birthday on, this kind of representation produces a very small amount of errors on population data.
Do you know a way how to solve this problem? Do you consider adding a feature on your next release? For now, I use R or Oracle BI to do this job. This can be much more time consuming than with Excel functions. Especially when I receive data in xls/csv format.
With much appreciation, Marc.
Marc,
The simplest way to resolve this issue based on Excel’s FREQUENCY function and Real Statistics’s FREQTABLE functions is to bins such as 11.9999999999, 23.9999999999, 35.9999999999, etc, instead of 12, 24, 36, etc.
I’ll add your suggested feature to my list of potential enhancements, but I can’t promise that it will be in the next release.
Charles
Hello Prof. Charles;
Thanks for all the tips.
Question: When using the native Frequency function (and when using routines that rely on Frequency function, such as creating Histograms), Excel rounds up every number that exceeds 50% of the range of the bin. For example, if I input bins 10, 20, 30…N, any numbers in my data matrix ranging from [10-15 will fall under bin 10, while numbers ranging from [15-25 will fall under bin 20, and so on. This is really a nuisance when trying to select the bins. Is there any way to stop Excel from rounding up the numbers before assorting them to the bin (i.e. force Excel to assort the number to the specified bin)? Thanks in advance.
Alexandre,
This is not how the FREQUENCY function works. If your bins are 10,20,30 and your data are 8, 12, 17, 20, 22, 28, then the frequency values for 10, 20, 30 are respectively 1, 3, 2. In particular, the frequency value for 20 (from 0,20,30) is the count of all data values larger than 10 and less than or equal to 20.
Charles
hEY,
How do you do the same thing when you have X and f(x)…it is not explained…
Frank,
Sorry, but I don’t understand your question.
Charles
Hi -Thanks very much for this statistics tool. I’m trying to make a frequency table on EXCEL for Mac released in late 2015. I got data from one column, but I can’t get the formula to work again. Do you know of a helpful resource for Excel on the Mac?
Theo,
There is a Mac version of the Real Statistics Resource Pack. See the webpage
Real Statistics for Mac
Charles
Hi Charles,
Before anything, I must congratulate you on your website. One of the best learning sites for statistics.
But with respect to the Frequency Tables page I recommend that you explain the computation of the mean and variance in terms of the first and second moments, e.g. E[X] and [EX^2]. This is what we have learned in college.
Mean = E[X] and var(X) = E[X^2] – (E[X])^2.
You sort of compute the first and second moments in figure 2 but it should be done on the probability table in figure 3. Any thoughts?
Wytek,
I have revised the referenced webpage to make things clearer. I have referenced Property 1 on another webpage which captures the moments idea.
For the probability table in Figure 3, I wanted to emphasize the idea of dividing by the sample size.
Charles
This is terrific! Thank you for sharing.
Question: What if I am calculating frequencies of nominal (categorical) data? Eg. frequencies of face-to-face contacts, phone call contacts, emails, and letters. I am preparing an electronic survey that contains a lot of these types of choices. In addition, there are open-ended questions whose responses will be put into categorical bins and displayed as frequencies. I ultimate question is this, “How do I determine a sample size for a survey with these kinds of questions? The population is 800. If you can give me any guidance or send me a reference, I would be most grateful. Thanks, Doug Clark
What sort of statistical analyses are you planning to perform?
Charles