On this webpage, we describe two data analysis tools that generate several key descriptive statistics for a data set.
Excel Support
Excel Data Analysis Tool: Excel provides a data analysis tool, called Descriptive Statistics, that produces a summary of key statistics for a dataset.
Click here for more information about the data analysis tools provided in Excel’s ToolPak.
Example 1: Produce a table of the most common descriptive statistics for the scores in column A of Figure 1.

Figure 1 – Output from Descriptive Statistics data analysis tool
The output from the data analysis tool is shown on the right side of Figure 1. To use the tool, select Data > Analysis|Data Analysis and choose the Descriptive Statistics option. A dialog box appears as in Figure 2.

Figure 2 – Dialog box for Excel’s data analysis tool
Now click on Input Range and highlight the scores in column A (i.e. range A3:A14). If you include the heading, as is done here, check Labels in first row. Since we want the output to start in cell C3, click the Output Range radio button and insert C3 (or click on cell C3). Finally, click on the Summary statistics checkbox and press the OK button.
Note that had we checked the Kth Largest checkbox, the output would also contain the value for LARGE(A4:A14, k) where k is the number we insert in the box to the right of the label Kth Largest. Similarly, checking the Kth Smallest checkbox outputs SMALL(A4:A14, k). The option Confidence Interval for Mean option generates a confidence interval using the t distribution as explained in One Sample t Test.
Multiple Sample Example
Excel’s Descriptive Statistics data analysis tool also allows you to report on multiple sets of data at the same time, as shown in the following example.
Example 2 – Use Excel’s Descriptive Statistics data analysis tool to show the descriptive statistics for the two samples on the left side of Figure 3.
The output from Excel’s Descriptive Statistics data analysis tool is shown on the right side of Figure 3.

Figure 3 – Excel’s Descriptive Statistics data analysis
Real Statistics Support
Real Statistics Data Analysis Tool: The Real Statistics Resource Pack provides the Descriptive Statistics and Normality data analysis tool which outputs the above statistics plus GEOMEAN, HARMEAN, MAD, AAD, and IQR. But instead of just generating the numerical value of each statistic, as Excel’s Descriptive Statistics data analysis tool does, the Real Statistics data analysis tool outputs the appropriate Excel formula for computing each statistic (see Figure 4 below). Thus whenever the input data values change, the output values will change automatically as well.
The Real Statistics Descriptive Statistics and Normality data analysis tool allows you to report on multiple sets of data at the same time, as shown in the following example.
Click here for more information about the Real Statistics data analysis tools.
Click here for more details about the Descriptive Statistics and Normality data analysis tool.
Real Statistics Example
Example 3 – Use Real Statistics’ Descriptive Statistics and Normality data analysis tool to show the descriptive statistics for the two samples on the left side of Figure 3.
Press Ctrl-m and select the Descriptive Statistics and Normality option. A dialog box will now appear as shown in Figure 4. Insert A5:B18 into the Input Range, making sure the Column headings included with data option is checked, and select the Descriptive Statistics option.
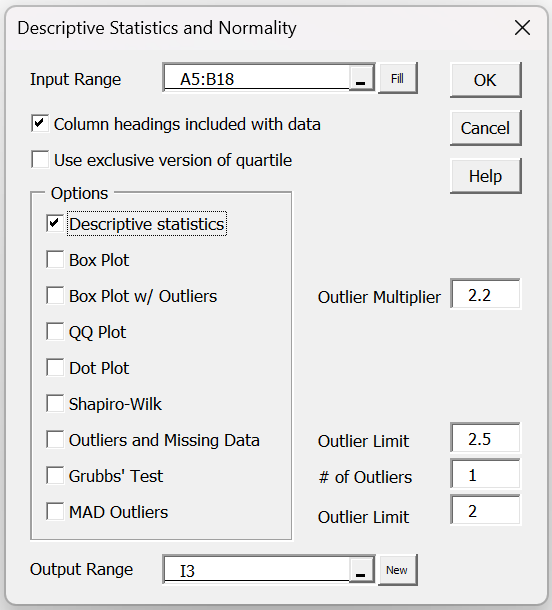
Figure 4 – Real Statistics dialog box
After clicking the OK button, the output shown in Figure 5 is displayed.

Figure 5 – Descriptive Statistics data analysis
As stated above, the data analysis tool generates formulas in each cell instead of the numerical values. E.g. cell J6 contains the formula =AVERAGE(A6:A18) instead of the value 30.46154.
Also note that cell J23 contains the formula =IQR(A6:A18), i.e. IQR based on the inclusive version of the quartile function. If you check the Use exclusive version of quartile field in the dialog box shown in Figure 4, then cell J23 would contain the formula =IQR(A6:A18, TRUE), i.e. IQR based on the exclusive QUARTILE.EXC function, producing the values 30 and 33.5 in cells J23 and K23 of Figure 5.
Links
Examples Workbook
Click here to download the Excel workbook with the examples described on this webpage.
Reference
ExcelTip (2021) How to perform descriptive analysis in Excel
https://www.exceltip.com/tips/descriptive-statistics.html
Too much information. Too little time! I have read and read and studied until I think I am going to drown in all the info. I can’t remember all of it and I have taken so many notes that I cant even make sense of them anymore. So I start over and then I have wasted too much time taking notes and then I have to hurry. I think I am going to try to get a tutor to help. Just hope it’s not too late. I don’t want to be late again turning in my assignments. This is crazy. But Ima try put this thing together. See how far I get. So far, I have only got the first two or three questions done. Kind of stuck. You can only read something so many times. Either you understand it or you don’t. And I don’t! Some of it. But for the most part, I just do not get it. It lost me with the E(Y)= something something . I know that E is the regression line. Or at least I think it is. I go from doing well to totally lost when I get to that point. Making the little chart for Y and X. How and where do them numbers come from? Anyway. It’s college. Nothing hardly makes sense. Thanks for listening!
Cindy,
This is a hard subject for lots of people. You are not alone. A tutor can point you in the right direction.
Probably E(Y) = the expected value of Y = the mean.
Charles
I am so with you on this, just so you know you’re not the only one!! Good luck
I agree with you i don’t get any thing out of it its too complicated.
Hello Fatima,
I have tried to walk the middle road on this website, not making it too difficult for beginners but also not making worthless for people with more knowledge. I recognize that I haven’t always succeeded. To understand this particular webpage, you need to review various topics in the the Descriptive Statistics part of the website, i.e. https://real-statistics.com/descriptive-statistics/
Charles
First, I want to commend your answers to the various comments that people have posted. A teacher should always be open to feedback.
Second, for what it’s worth, this material is presented pretty straightforwardly. I’m unsure how else a text-based lesson could be further simplified. If a person cannot understand these rudimentary explanations, there are other areas they may need to focus on (e.g. English, statistical concepts). It appears people are putting the cart before the horse (trying to use statistical tools without understanding the underlying statistics, at least at a basic level) or mistaking the husk for the corn (what your screenshots look like are beside the point, as long as the functionality and relative location of the feature remain).
Thank you very much, Eddie. I appreciate your comments.
Charles
Eddie
Your comment may be off putting especially when you use the term rudimentary- it wasn’t kind or necessary. It also comes across as being arrogant. And yes, there may be a language barrier, so what. The teacher or professor put this together to help people. Let’s just be mindful of that. Thank you Charles for this contribution.
Respectfully,
Cameron
This tool is a little hard to understand and use, especially if you are a first time user for this type of tool use. I wish I could understand this a little bit better.
Hi Naomi,
Thanks for your feedback. There is a lot of other information on the website that provides more details about how to use these tools.
I have just added some links to other webpages which I hope will make it easier to use the Descriptive Statistics data analysis tools.
For the Excel tool, see Excel Data Analysis Tool
For the Real Statistics tool, see Descriptive Statistics and Normality Tool
Charles
This is confusing me more than I began. Not only is this description using an outdated form of Excel for the explanation, the information is not detailed enough. Not everyone is already versed in statistics or excel when starting this class. This should be more descriptive and have updated visuals to be more inclusive to all users.
Hi Gabriella,
Thanks for your feedback. I am sorry that you found the description confusing. Part of the problem is that this webpage only provides part of description. There is a lot of other information on the website that provides more details about how to use these tools.
I have just added some links to other webpages which I hope will make it easier to use the Descriptive Statistics data analysis tools.
1. For the Excel tool, see Excel Data Analysis Tool
2. For the Real Statistics tool, see Descriptive Statistics and Normality Tool
3. You also said that the description uses an outdated version of Excel. I don’t see anything on this webpage that uses an old version of Excel. The worksheet that you can download probably does use some of Excel 2007 worksheet functions. I have done this since, believe it or not, some people are still using Excel 2007. In these cases, I have tried to indicate what the latest function names are. If I have not done this, please let me know.
Charles
I love this! Having just come from the world of pharmaceutical research this explanation makes me so excited!
This is very complicated for a person who has not done this in a very long time. I am more lost and confused than i was before reading this. This complicates things and makes me want to drop this class.
Hello Angel,
I agreed that this is not so easy. This webpage only describes the data analysis tool. It might be better to first read the part of the website at https://real-statistics.com/descriptive-statistics/
Charles
I agree with you. so lost
Too many steps that are difficult to understand for someone who does not use this type of tools or formats on a daily basis. Is there another way to simplify this? TOO MANY STEPS NOT ENOUGHT VISUALS. not very good teaching tool. |:(
I appreciate your comment even though it is not favorable to me. In any case, I will continue to try to make the material more understand to a larger audience. I know in advance that not everyone will understand the materials and tools. I also understand that if I simplfy things too much some part of the audience will become bored and stop using the website and tools. This is always a compromise. So far I have managed to attract a large audience and many people are using the website and software for their work and studies.
Charles
exactly. I want to cry.
I do not understand any of this
Michelle,
This webpage describes two data analysis tools. The first is supplied by Excel. The second is supplied by the Real Statistics add-in to Excel. You can access this data analysis tool (and others) once you have downloaded and installed the free Real Statistics add-in.
Charles
same
How do you determine regression equations? How to break it down step by step?
Hi Sheryl,
See
https://www.real-statistics.com/regression/
https://www.real-statistics.com/multiple-regression/
Charles
hi
whenever i am doing output range its showing me, ‘Compile error in hidden module: Analysis’. please help
Hello Rajesh,
What do you see when you enter the formula =VER() in any cell?
If you send me an Excel file with your data, I will try to figure out what is going wrong.
Charles
I am using this tool at the moment to analyse a set of data from 10 M&As but the problem is, it is hard for me to explain/interpret the results in my analysis.
In what way is it hard for your to explain/interpret the results?
Charles
Question regarding the MAD:
MAD can be Mean Absolute Deviation or Median Absolute Deviation? With the sample data set this function returns 12. Using =SUM(ABS(K2:K14-AVERAGE(K2:K14)))/COUNT(K2:K14) Excel returns 13.7988165680473 and using =SUM(ABS(K2:K14-MEDIAN(K2:K14)))/COUNT(K2:K14) it returns 13.4615384615385 (both array entered.)
Obviously I am not following something, but what?
Very good teaching but i have not exactly understood statistical tools used to analyse both quantitative and qualitative data