We consider a random variable x and a data set S = {x1, x2, …, xn} of size n that contains possible values of x. The data set can represent either the population being studied or a sample drawn from the population.
Looking at S as representing a distribution, the skewness of S is a measure of symmetry, while kurtosis is a measure of the relative size of the tails of this distribution.
Symmetry and Skewness
Definition 1: Skewness as a measure of symmetry. If the skewness of S is zero, then the distribution represented by S is perfectly symmetric. If the skewness is negative, then the distribution is skewed to the left, while if the skewness is positive, then the distribution is skewed to the right (see Figure 2 below).
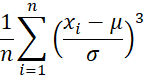
Excel calculates the skewness of a sample using the formula:

where x̄ is the mean and s is the standard deviation of S. To avoid division by zero, this formula requires that n > 2.
When a distribution is symmetric, the mean = the median. When the distribution is positively skewed the mean > the median and when the distribution is negatively skewed the mean < the median.
Worksheet Functions
Excel Functions: Excel provides the SKEW function as a way to calculate the skewness of S, i.e. if R1 is a range in Excel containing the data elements in S then SKEW(R1) = the skewness of S.
There is also a population version of the skewness given by the formula
Excel users starting with Excel 2013 can employ the function SKEW.P to obtain the population skewness.
Users of Excel before Excel 2013 can use the formula
= SKEW(R1)*(n–2)/SQRT(n*(n–1))
instead of SKEW.P(R1) where R1 contains the data in S = {x1, …, xn} and n = COUNT(R1).
Real Statistics Function: Alternatively, you can calculate the population skewness using the SKEWP(R1) function, which is contained in the Real Statistics Resource Pack.
Example
Example 1: Suppose S = {2, 5, -1, 3, 4, 5, 0, 2}. The skewness of S = -0.43, i.e. SKEW(R1) = -0.43 where R1 contains the data in S. Since this value is negative, the curve representing the distribution is skewed to the left (i.e. the fatter part of the curve is on the right). Also SKEW.P(R1) = -0.34. See Figure 1.
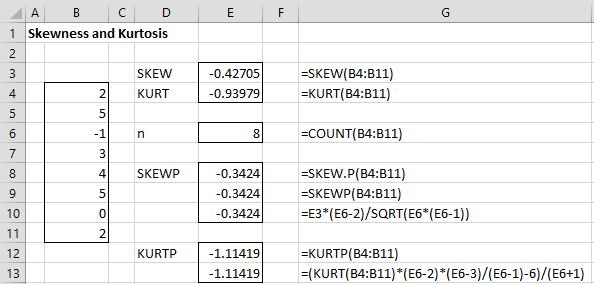
Figure 1 – Examples of skewness and kurtosis
Observation: SKEW(R1) and SKEW.P(R1) ignore any empty cells or cells with non-numeric values.
Kurtosis
Definition 2: Kurtosis provides a measurement of the extremities (i.e. tails) of the distribution of data, and therefore indicates the presence of outliers.
Excel calculates the kurtosis of a sample S as follows:
![]()
where x̄ is the mean and s is the standard deviation of S. To avoid division by zero, this formula requires that n > 3.
Observation: It is commonly thought that kurtosis provides a measure of peakedness (or flatness), but this is not true. Kurtosis pertains to the extremities and not to the center of a distribution.
Worksheet Functions
Excel Function: Excel provides the KURT function as a way to calculate the kurtosis of a sample S, i.e. if R1 contains the data elements in S then KURT(R1) = the kurtosis of S.
Observation: The population kurtosis is calculated via the formula

You can obtain the population kurtosis by using the Excel formula
=(KURT(R1)*(n-2)*(n-3)/(n-1)-6)/(n+1)
Real Statistics Function: Excel does not provide a population kurtosis function, but you can use the following Real Statistics function for this purpose:
KURTP(R1, excess) = kurtosis of the distribution for the population in R1. If excess = TRUE (default) then 3 is subtracted from the result (the usual approach so that a normal distribution has a kurtosis of zero).
KURT(R1) and KURTP(R1) ignore any empty cells or cells with non-numeric values.
Example 2: Suppose S = {2, 5, -1, 3, 4, 5, 0, 2}. The kurtosis of S = -0.94, i.e. KURT(R1) = -0.94 where R1 contains the data in sample S. If S is instead a population, then the kurtosis is KURTP(R1) = -1.114. See Figure 1.
Graphical Illustration
We now look at an example of these concepts using the chi-square distribution.

Figure 2 – Example of skewness and kurtosis
Figure 2 contains the graphs of two chi-square distributions (with different degrees of freedom df). We study the chi-square distribution elsewhere, but for now, note the following values for the kurtosis and skewness:

Figure 3 – Comparison of skewness and kurtosis
Both curves are asymmetric and skewed to the right (i.e. the fat part of the curve is on the left). This is consistent with the fact that the skewness for both curves is positive. However, the blue curve (df = 5) is more skewed to the right, which is consistent with the fact that the skewness of the blue curve is larger.
Links
Examples Workbook
Click here to download the Excel workbook with the examples described on this webpage.
References
Howell, D. C. (2010) Statistical methods for psychology (7th ed.). Wadsworth, Cengage Learning.
https://labs.la.utexas.edu/gilden/files/2016/05/Statistics-Text.pdf
Turney, S. (2023) Skewness | Definition, examples & formula
https://www.scribbr.com/statistics/skewness/#:~:text=Skewness%20is%20a%20measure%20of,negative)%2C%20or%20zero%20skewness.
Turney, S. (2023) Kurtosis | Definition, examples & formula
https://www.scribbr.com/statistics/kurtosis/#:~:text=Kurtosis%20is%20a%20measure%20of,(thin%20tails)%20are%20platykurtic.
If the data is highly skewed, can we still rely on the kurtosis coefficient?
Grace,
As far as I am aware, this definition of kurtosis is valid even when the data is highly skewed.
Charles
Sure, kurtosis just measures tail extremity. If the distribution is highly skewed, such extremity occurs only in one tail.
Is there a function in excel that helps us to transform data from ungrouped to grouped?
Nasreen,
It depends on what you mean by grouped data. The Real Statistics Resource Pack provides various approaches for doing this, but again it depends on what you mean by grouped data.
Charles
Hello Charles,
is there a formula to calculate skewness on filtered data?
Best wishes
Hello Phoebe,
How is the data being filtered?
Charles
does skewness and kurtosis has statistical table, please i want to learn more about how it is applied both the calculation. thanks
Hello Ruth,
You can test for skewness and kurtosis using the normal distribution as described on the following webpages>
https://real-statistics.com/tests-normality-and-symmetry/analysis-skewness-kurtosis/
https://real-statistics.com/tests-normality-and-symmetry/statistical-tests-normality-symmetry/dagostino-pearson-test/
Charles
Can you further explain what do you mean by extremities (i.e. tails) of the distribution of data, and therefore provides an indication of the presence of outliers.
Since, my reading suggested that Kurtosis is about peakness of the data.
Hello Shazia,
1. The extremities are simply the highest and lowest data values.
In many distributions (e.g. the normal distribution) there is no highest or lowest value; the left tail (where the lower values lie) goes on and on (towards minus infinity), but for intervals of a fixed size on the left tail there are fewer and fewer values the farther to the left you go (and certainly far fewer values than in the middle of the distribution). You can see this on the typical bell curve of the normal distribution. The situation is similar on the right tail (where the higher values lie). It goes on towards plus infinity and for any given interval size there are fewer and fewer values on the farther you go to the right.
When you look at a finite number of values (e.g. in a finite sample) then if some value is much smaller or much bigger than the other values, these are potential outliers. There is no precise definition of an outlier. It is a judgement call as to whether some value is an outlier, although there are guidelines (as explained on the website).
2. Older references often state that kurtosis is an indication of peakedness. This is not correct.
Charles
Hello, If I have a set of percentage data and if I try to find Skew for this percentage data then I get the answer in percentage say I have R = 93 data points in a set S and this 93 data points in the range R are in percentages if I apply SKEW(R) then I get answer in percentage which is equal to say 9.2 percentage, if I convert it to number format it turns out to be 0.09 what does this mean, is this data moderately skewed because it’s less than + or – 0.5 or how to consider this result in percentages( I have negative percentages in my data set, and the mean in lesser than median that means negativity skewed but the skewness is 0.09 if I convert it to number format from percentages so what’s the problem)
Hello, it is difficult for me to figure out what is going on without seeing your data. If you can send me an Excel file with your data, I will try to figure out what is happening.
Charles
In terms of financial time series data, would the measure of Skew and Kurtosis for a single position indicate which GARCH (or other) model to use in calculating it’s conditional volatility? I know this is slightly off topic, so no worries if the answer isn’t forthcoming.
Andrew,
I guess this is possible, but I honestly don-t have the time to think this through.
Charles
Thank you Charles for your well-described functions of Skew and Kurt. My question is how these 2 factors can help me interprete the normality of my data. For example are there certain ranges in which we can be certain that our range is not normal. For example, the Kurtosis of my data is 1.90 and Skewness is 1.67. How these 2 numbers could help me know if running a t-test would be meaningful on this dataset?
Thank you in advance
Hadi,
See the following two webpages:
https://real-statistics.com/tests-normality-and-symmetry/analysis-skewness-kurtosis/
https://real-statistics.com/tests-normality-and-symmetry/statistical-tests-normality-symmetry/dagostino-pearson-test/
Charles
Hi Sir Charles, may I know if the formula for grouped and ungrouped data of skewness and kurtosis are the same?
Kath,
I am not sure I know what you mean by grouped and ungrouped data. Say you have a range of data A1:C10 in Excel, where the data for each of three groups is the data in each of the columns in the range. Then the overall skewness can be calculated by the formula =SKEW(A1:C10), but the skewness for each group can be calculated by the formulas =SKEW(A1,A10), =SKEW(B1:B10) and =SKEW(C1:C10).
Charles
hi charles,
what happen if my skewness is -.999? what does -.999 means? it is still normal?
Hafiz,
The distribution is skewed to the left. Skewness of -.999 (i.e. about -1) is usually consistent with data that is normally distributed (skewness = zero), but whether the data is normally distributed depends on other factors as well.
Charles
Hi Charles,
How do I incorporate weights in the skewness calculation? Say the value 5 appear 3 times, 8 appears 2 times and 9 appears once. I have the formula SKEW(5, 8, 9) – using cell references, but would like the calculation to be SKEW(5, 5, 5, 8, 8, 9).
Kind regards,
Maree
Maree,
You can use the formula =SKEW(5, 5, 5, 8, 8, 9) to calculate this.
You can also use the approach described on the following webpage:
https://real-statistics.com/real-statistics-environment/data-conversion/frequency-table-conversion/
See especially Figure 4 on that webpage.
Charles
How can we write about line symmetry and mirror symmetry if asked separately from kurtosis & skewness?
Pranjal Srivastava,
To test for symmetry algebraically about the y axis you take the equation y = f(x) and substitute -x for x and see whether you get the same equation back. Similarly, you can test for symmetry about the x axis or about the origin.
In the referenced webpage, I am not testing for 100% symmetry. I am testing whether the data is symmetric enough that I can use one of the standard statistical tests.
Charles
can u explain more details about skewness and kurtosis.
What sort of detail are you looking for?
Charles
may be just to explain for her more about it
Whose comment are you referring to?
Charles
How do i compare skewness and kurtosis?
Namrata,
See https://real-statistics.com/tests-normality-and-symmetry/analysis-skewness-kurtosis/
Charles
Please let me know if we have some data set with sizes with volume percentages to calculate skewness and kurtosis, Do I need to divide the data set into same size classes or different size classes is okay.
Sonali,
Sorry, but I don’t understand your question.
Charles
Sir, if the value of the SKEWNESS is zero, it means that the distribution in the curve is symmetric, if the value falls within -0.49 <SK< 0.49 (since -0.49 and 0.49 when rounded of is 0), may i say that the distribution may still be SYMMETRIC?
how about in kurtosis, if the value is within 2.50 <KU<3.49 (since 2.50 and 3.49 when rounded of is 3), may i say that the distribution may still be MESOKURTIC?
Thank you very much
Chris,
This sort of rounding approach is not what is commonly used (nor does it have much validity). You can test whether skewness is significantly different from zero (and similarly for kurtosis) as described on the following webpage:
https://real-statistics.com/tests-normality-and-symmetry/statistical-tests-normality-symmetry/dagostino-pearson-test/
Charles
thank you, for your quick response.
Hi, Charles,
The skewness formula is not shown correctly on the page.
Are there different measures of skewness? For example, I found from this site (http://www.statisticshowto.com/pearsons-coefficient-of-skewness/) that the formulas used to calculate skewness are different from the ones you show here. How can I interpret the different results of skewness from different formulas?
Best,
Xiaobin,
The two statistics that you reference are completely different from the measurement that I have described. I have never used the measures that you have referenced. I presume that measure skewness and are easier to calculate than the standard measurement (which is the one that I describe) and so are less accurate.
See the following webpage for further explanation:
https://en.wikipedia.org/wiki/Skewness
Charles
How to determine skewness for qualitative variable?
I think the Kurtosis formula is too long to be crammed, can I get assistance on how go understand if?
What do you mean by crammed? Please explain what you are looking for.
Charles
hello,
the Kurtosis value on my data is above 2 (+3). i think it should be between negative and positive 2. how can I change it to obtain normality??
hi;
I want to make sure by ” n ”
did you mean the sample size ?
Yes, n = sample size.
Charles
Hey Charles
Say you had a bunch of returns data and wished to check the skewness of that data. In this instance, which would be appropriate – Skew() or Skew.P()
I would imagine Skew() because Skew.P() refers to a population and you don’t have the population here, you merely have a bunch of return data don’t you. OR when dealing with financial returns do you assume that the data you have is the population?
Steven,
You would probably use SKEW(), although the results are probably fairly similar.
Charles
I want two suggestion
1. I have 1000 dollar money i wants to distribute it in 12 month in such a way that peak is 1.6 time the average ( using normal distribution curve)
2. As per my knowledge the peak in bell curve is attended in mean (i.e by 6.5 month) but if i want peak at 40% month (i.e 12*40/100 time ) and peak will still remain 1.6 time the average( i.e peak= 1.6*100/12) than what will be the distribution
The peak is usually considered to be the high point in the curve, which for a normal distribution occurs at the mean. Thus, I don’t know what it means for the peak to be 1.6 times the average (which is the mean). Please explain what you mean by the peak?
Charles
very dificult to compute a curtosis how to be know a sample is group or ungrouped data
Jessa,
You can compute kurtosis using the KURT function. I don-t understand teh part about group or ungrouped data.
Charles
What the differences and similarities between skewness and kurtosis?
This is described on the referenced webpage. Perhaps you have a more specific question?
Charles
Based on my experience of teaching the statistics, you can use pearson coefficient of skewness which is = mean – mode divide by standard deviation or use this = 3(mean – median) divide by standard deviation. mostly book covered use the first formula for ungrouped data and second formula for grouped data
Prof Amir,
Thank you very much for this suggestion. I will add something about this to the website shortly. I also found an interesting article about the usefulness of these statistics, especially for teaching purposes:
http://www.amstat.org/publications/jse/v19n2/doane.pdf
Charles
“the kurtosis value of the blue curve is lower” should read “the kurtosis value of the blue curve is higher”.
In fact, zero skew is seldom observed. See for example http://www.aip.de/groups/soe/local/numres/bookcpdf/c14-1.pdf
Gaylord,
Thanks for catching this typo. I have now corrected the webpage. I appreciate your help in making the website better.
Charles
but this of yours still considers kurtosis as peakedness
Hi Charles. I want to know ‘what is the typical sort of skew?’
Soniya,
I don’t know of any typical sort of skew. The bell curve has 0 skew (i.e. it is symmetric).
Charles
Thank you Charles.
Using the scores I have, how can I do the GRAPHIC ILLUSTRATION of skewness and kurtosis on the excel?
Namo,
I am not sure what you mean by a graphic illustration. I have tried to do this with the graph of the chi-square distribution, which was done using Excel (see the details in the Examples Workbook, which you can download for free).
Charles
Thanks for helping us understanding those basics of stat.