Frequency Table to Individual Samples
We first show how to change data that is presented in frequency table format into individual samples with repetitions (i.e. raw data with repetitions).
Example 1: Convert the data in the frequency table with seven observed scores shown in range A5:B12 of Figure 1 into raw data format. The cumulative frequencies are shown in column C, although these won’t be used to create the raw data.
To accomplish this, we build the table on the right side of Figure 1. Column E contains the resulting 15 raw data elements in the sample, and Columns F and G are used to create the values in column E.
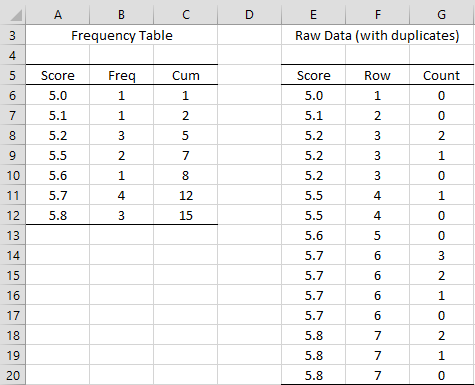
Figure 1 – Conversion from frequency table to raw data
The Row column contains a pointer to the row in the Frequency Table that is being processed (the current row), starting with 1 and ending with 7 (since there are 7 rows in the Frequency Table). The Count column contains the number of times the score in the current row of the Frequency Table still needs to be duplicated.
Creating the Raw Data Table
To create the Raw Data table, we start by creating the first two rows of the table. The contents of the cells in these rows are as shown in Figure 2.
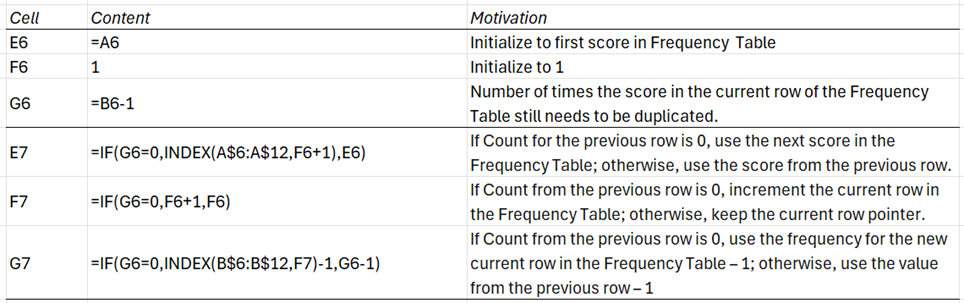
Figure 2 – Key Formulas
You can now fill in the values for the other rows in the Raw Data Table by highlighting the range E7:G20 and pressing Ctrl-D. This copies the formulas in the second row of the table into the other 13 rows of the table. Note that if you highlight a longer range and press Crtl-D you will get the same result for the first 15 rows of the table and then error values (which can then be removed).
Worksheet Functions
Real Statistics Functions: The following array function, furnished by the Real Statistics Resource Pack, provides similar functionality to that described above.
FREQ2RAW(R1, R2): outputs a column vector with the raw data corresponding to the data in the frequency table described by R1 and R2, where R1 contains the data items in the frequency table, and R2 contains the corresponding frequencies
FREQ2RAW(R1): equivalent to FREQ2RAW(R2,R3) where R2 is the first column of R1 and R3 is the second column of R1.
See Descriptive Statistics for Frequency Tables for examples of the use of the FREQ2RAW function.
Individual Samples to Frequency Table
Converting from raw data with possible repetitions to a frequency table is relatively simple. First, copy the data scores (using Paste Values if necessary) to a new place in the worksheet. Then select this range of cells and click on Data > Data Tools|Remove Duplicates. (If the data was not in sorted order, you would first use Data > Sort & Filter|Sort). Then use the COUNTIF function to count how many times each score appears in the sample data.
Example 2: Create a frequency table for the data in range A6:A20 of Figure 3.
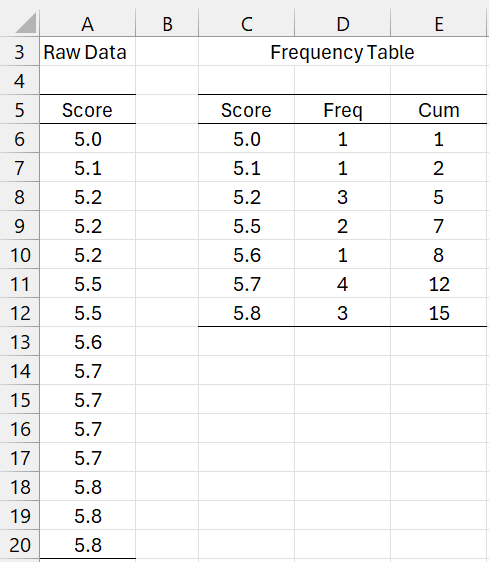
Figure 3 – Converting raw data to a frequency table
The resulting frequency table is shown on the right side of Figure 3 using the procedure described above. E.g. cell D6 contains the formula =COUNTIF($A$6:$A$20,C6). The result is as Figure 3. Cell E7 contains the formula =E6+F7.
Also, see Example 2 in Discrete Probability Distributions for an example using the Real Statistics function FREQTABLE.
Data Analysis Tools
You can also use the Real Statistics Histogram with Normal Curve Overlay data analysis tool to create a frequency table from raw data. Use of this tool is explained in Discrete Probability Distribution. The output when leaving the Bin Size field blank is shown in the leftmost side of Figure 4 (omitting the histogram).
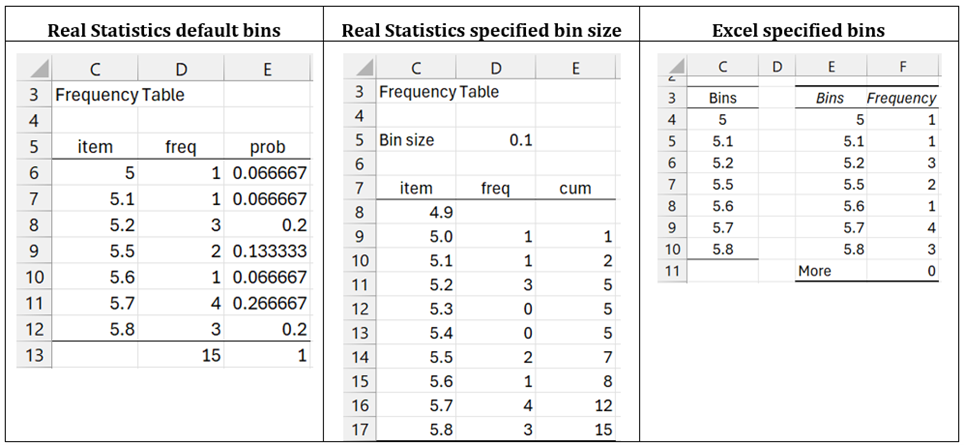
Figure 4 – Data analysis tool results
You can also use the same tool to create the output shown in the middle of Figure 4. This time, the Bin Size is set to .1. See Histograms.
Finally, we can use Excel’s Histogram data analysis tool to obtain the result shown on the right side of Figure 4. This time, we must explicitly define the bins (as shown in range C4:C10). This is also explained in Histograms.
Links
↑ Data conversion and reformatting
Examples Workbook
Click here to download the Excel workbook with the examples described on this webpage.
References
Turney, S. (2023) Frequency distributions: tables, types and examples
https://www.scribbr.com/statistics/frequency-distributions/
Langmann, K. (2024) How to make a frequency table in Excel
https://spreadsheeto.com/frequency-table-excel
Kaminski, J. (2024) Frequency table in math – definition & examples
https://brighterly.com/math/frequency-table/
That function that converts frequencies to raw data is great!
If I only knew I would have saved several hours of exhausting work I made a few months ago…
Thanks!
Hello Carlo,
Glad that this function was helpful and hopefully it will save you time in the future.
Charles
Great article to convert summary data back to individual data points. It helped me recreate 40,000 data points from a summary table!
I was a bit confused in ‘Figure 3 – Formulas in the second row’ as it didn’t line up with your data ($A$6:$B$12). The formulas should be listed as:
E7 =IF(G6=0,INDEX($A$6:$A$12,F6+1),E6)
F7 =IF(G6=0,F6+1,F6)
G7 =IF(G6=0,INDEX($B$6:$B$12,F7)-1,G6-1)
The ‘Motivation’ info on the side was well written, so it was easy to figure out what the formulas should be.
Thanks again for writing this up!
Best Regards,
Mladen
Hello Mladen,
Glad that you found this article useful and thank you for finding the errors in the formulas. I have now corrected the webpage.
Charles
It seems as though everywhere the FREQ2RAW function is used, an error is returned for the calculated value (i.e. median, geometric mean, IGR, and ALL data values for the raw data table!!!), any thoughts as to what the problem might be?
Rick,
FREQ2RAW is an array function and so you need to press Ctrl-Shft-Enter and not just Enter when you use it. See the following webpage fpr details: Array Functions and Formulas
Charles
Can the frequency counts be non-integer numbers, e.g., 1.35, 2.99, etc?
Hector,
Frequency counts are non-negative integers. Why are you asking the question? Do you have a situation where you could use non-integer counts?
Charles
Yes. This is related to an email I sent you about using sample weights. I was thinking if the Freq2Raw function takes non-integers, then that might be the unction needed to deal with weighted data.
Hector,
The Freq2Raw function doesn’t take non-integer values (it actually rounds non-integer values off to the nearest integer).
Charles
Charles,
Your tool works beautifully for my research.
I had frequency table form ArcGIS and needed to see raw data, and it worked!
Thanks,
Scott
Thank you scott see you in goon town!
Dear Sir
The method is precise and very good in general but need to be modified when zero frequency occurs in some of the data. Is it possible to add some IF statements to improve?
Best Regards
Sam
Samuel,
Thanks for identifying this issue. Based on your comment, I plan to update the referenced Excel formulas to handle zero frequency.
Please note that the Real Statistics function and data analysis tool do handle zero frequency correctly.
Charles
I have data collected by sample questionnaire. I didn’t know how to prepare raw table, I transferred the data in excel as frequency data sheet.
I tried to take out mean, SD, correlation, Fratio, but all of them resulted in wrong answer.
Is there, anyone to guide me ASAP. As all of my theis work is pending due to data analysis. Please someone help and guide me through.
Thanking you in advance.
Sincerely
Sharifi
Sharifi,
The objective of the website is to help people to carry out various types of statistical analyses such as the one you are trying to do. If you send me the Excel spreadsheet with the input data and the calculations which result in the wrong answers I will try to identify what went wrong.
Charles