Introduction
Colors in Excel are defined by an RGB (red/green/blue) code of the form
RGB = Red + Green * 256 + Blue * 2562
where Red, Green, and Blue are integer values from 0 to 255 representing the intensity of that primary color. This is the coding used by Excel. Other sources use the coding: RGB = Blue + Green * 256 + Red * 2562.
On this webpage, we describe how to use colors in Excel.
Worksheet Functions
Real Statistics Functions: The Real Statistics Resource Pack contains the following functions that allow you to test whether cells in your spreadsheet have a specified font or background (i.e. fill) color or are bold.
FillRGB(R1) returns the RGB background color value of the cells in range R1 (if the background colors of the cells differ, then zero is returned).
FontRGB(R1) returns the RGB font color value of the cells in range R1 (if the font colors of the cells differ, then zero is returned).
RedRGB(rgb1) returns the value (0-255) of the red component of the RGB value rgb1
GreenRGB(rgb1) returns the value (0-255) of the green component of the RGB value rgb1
BlueRGB(rgb1) returns the value (0-255) of the blue component of the RGB value rgb1
RGBX(red, green, blue) returns the RGB coding for a color with the stated red, green, and blue components.
RGBRev(n) returns the Blue + Green * 256 + Red * 2562 coding when n is the RGB coding used by Excel, and returns the Excel RGB coding when n is the Blue + Green * 256 + Red * 2562 coding.
IsBold(R1) returns the value TRUE if all the cells in range R1 are bold and FALSE otherwise.
For example, if FillRGB(“A1”) = 16734822 = 102 + 90*256 + 255*256^2, then RedRGB(FillRGB(“A1”)) = 102, GreenRGB(FillRGB(“A1”)) = 90 and BlueRGB(FillRGB(“A1”)) = 255.
Examples
We show how to use these functions in Figure 1.
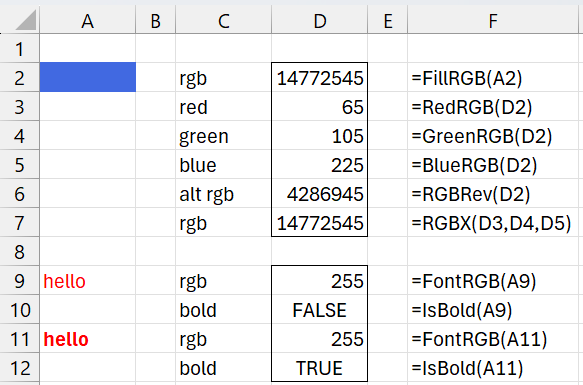
Figure 1 – Color function examples
Named Colors
Real Statistics supports a list of 128 named colors. Figure 1 lists these named colors and their RGB codes.
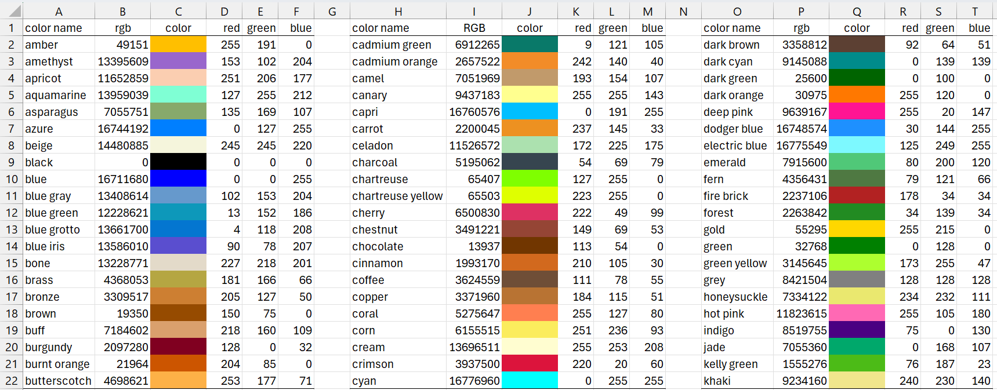
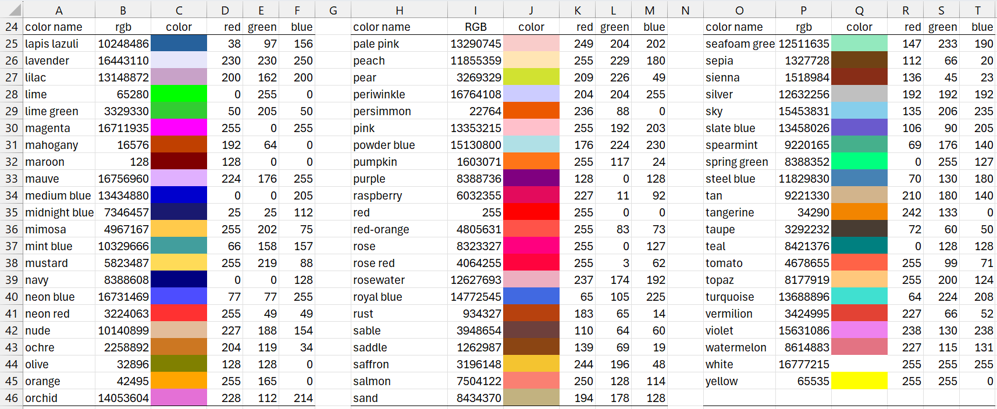
Figure 2 – 128 named colors
Data Analysis Tool
Real Statistics Data Analysis Tool: The Real Statistics Resource Pack contains the Color Assignment data analysis tool that allows you to fill a range with any of the 128 named colors.
For example, to fill cell A1 with the cyan color, press Ctrl-m, and choose the Color Assignment option from the Desc tab. The dialog box shown in Figure 3 will appear. Enter A1 in the Output Range, scroll down to the cyan color in the list, and click on the OK button.
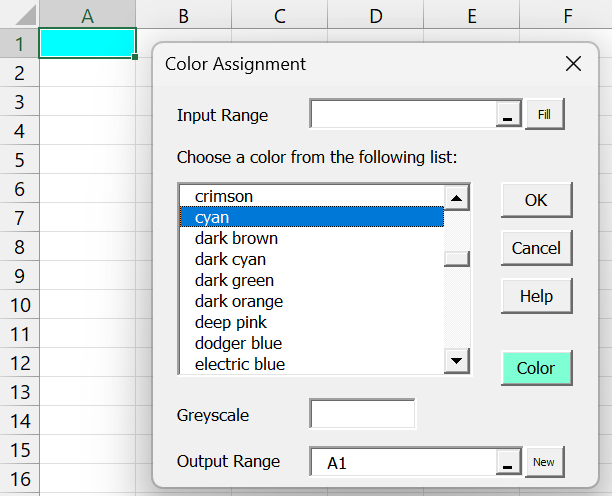
Figure 3 – Color Assignment dialog box
The result is shown in cell A1 in Figure 3. Note that after pressing the OK button, the dialog box in Figure 3 remains open and the Output Range automatically advances to the next cell in the same column (A2 for this example). You can now select a background color for this cell. To terminate this data analysis tool, you need to click on the Cancel button.
You can also see what a color looks like without entering it into the spreadsheet. E.g. to see what aquamarine looks like, find the color on the list, and click on the Color button instead of the OK button. The background of the Color button changes to the selected color, as shown in Figure 3.
Selecting colors based on RGB codes
Note that for this example, the Input Range field was left blank. If, instead, you fill in the Input Range, then the output range (i.e., the range whose upper-left-hand corner starts at the cell shown in the Output Range field) is filled in with the background colors whose RGB codes appear in the input range. The output range will have the same size and shape as the input range.
E.g. if you insert B25:B46 from Figure 2 in the Input Range, C25 in the Output Range, and then click on the OK button, the output will be as shown in range C25:C46 of Figure 2. Note that in this case, the color list in the dialog box is not used.
Greyscale
You can also use the Color Assignment data analysis tool to fill individual cells with greyscale colors. This is done by entering the greyscale code in the Greyscale field of the dialog box in Figure 4 and selecting “grey” from the color list (instead of “cyan”).
For example, if you insert 210 in the Greyscale field, then the color “grey210” would be displayed in cell G3.
If you leave the Greyscale field blank, then it defaults to 128.
Note that the RGB code for “grey210” is (1+256+2562)210 = 13816530, and similarly for other shades of grey.
See Greyscale for more information about using greyscale coding.
More Worksheet Functions
Real Statistics Functions: The Real Statistics Resource Pack contains the following functions related to the named colors.
RGBCode(text) returns the RGB value of the color named in text
FillColor(R1) returns the fill color of R1 as text. If no match is found, then “unknown is returned.
FontColor(R1) returns the font color of R1 as text. If no match is found, then “unknown is returned.
The text argument in the RGBCode function (as well as the output from the FillColor and FontColor functions) can take any of the 128 named colors, “amber”, “amethyst”, etc., shown in Figure 3.
Note that RGBCode(“red”) = 255, RGBCode(“yellow”) = 255 + 256*255 = 65535, RGB(“salmon”) = 250 + 256*128 + 256^2*114 = 7504122, etc.
These worksheet functions enable you to test whether a cell (or range) has a particular color (or is bold). For example, FillColor(A1) = “red” returns TRUE if cell A1 has a red background color. FillRGB(A1) = FillRGB(A2) returns TRUE if cells A1 and A2 contain the same background color (even if not one of the 128 named colors).
Actually, the FillColor and FontColor functions accept two additional arguments that are applicable when an exact match is not required. These are explained in Closest Color.
Examples
Figure 4 provides some examples of the use of these functions.
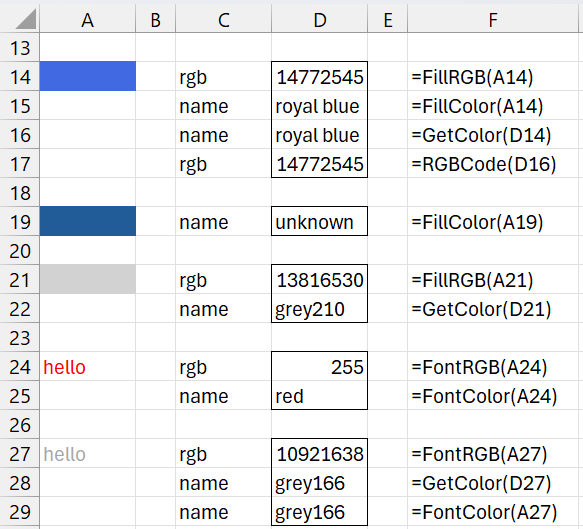
Figure 4 – More color function examples
Links
Examples Workbook
Click here to download the Excel workbook with the examples described on this webpage.
References
Microsoft Office (2018) Add or change background color of cells
https://support.microsoft.com/en-us/office/add-or-change-the-background-color-of-cells-ac10f131-b847-428f-b656-d65375fb815e
Dynamsoft (2019) Image processing 101 chapter 1.3: color space conversion
https://www.dynamsoft.com/blog/insights/image-processing/image-processing-101-color-space-conversion/
Wikipedia (2024) Grayscale
https://en.wikipedia.org/wiki/Grayscale