Objective
On this webpage, we evaluate how close two colors are to each other. In particular, we look at several measures of the distance (actually, distance squared) between two colors. We prefer a measurement that reflects human visual perception. In particular, if the human eye cannot perceive a difference between two colors, then we prefer that the distance measurement be small.
We start with measurements based on the RGB coding.
RGB Squared Distance
The simplest measure is the Euclidean distance squared, namely
(r1 – r2)2 + (g1 – g2)2 + (b1 – b2)2
where r1, g1, b1 are the RGB values of one color and r2, g2, b2 are the RGB values of the other color.
Actually, the following weighted Euclidean distance squared metrics are preferred since they better reflect human visual perception.
Alternative 1: The squared distance between two colors is equal to
The squared distance between two colors is equal to

Alternative 2: The squared distance between two colors is equal to

which is similar to the approach used to convert a color to greyscale (see Greyscale).
L*A*B* Color Coding
L*A*B* coding is an alternative to RGB coding that was designed to reflect human visual perception more faithfully. Here, L* measures the luminance of an object, with 0 = black and 100 = white. A* varies between green (negative values) and red (positive values. B* varies between blue (negative values) and yellow (positive values). Usually, A* and B* are constrained to values between -128 and 127.
The coding used depends on the referenced white light, which usually uses the D65 standard.
We can convert RGB coding to L*A*B* coding via an intermediate XYZ coding.
Converting from RGB to XYZ
To convert from RGB scale to XYZ scale, we set



where


Converting from XYZ to L*A*B*
To convert from XYZ scale to L*A*B* scale, we set



where



using the D65 standard (1931). Actually, we will use the updated D65 standard (1964), where

Worksheet Functions
Real Statistics Functions: The Real Statistics Resource Pack contains the following functions.
RGB2LAB(red, green, blue, ref) returns a 1 × 3 array with the L*a*b* coding for a color with the referenced red, green, and blue components.
RGB2XYZ(red, green, blue) returns a 1 × 3 array with the XYZ coding for a color with the referenced red, green, and blue components.
XYZ2LAB(x, y, z, ref) returns a 1 × 3 array with the L*A*B* coding for a color with the referenced X, Y, and Z components.
ref takes the values “d65” (default), which uses the D65 (1964) standard, and “d65x”, which uses the D65 (1931) standard.
ColorCodes(rgb1, ctype) returns a 1 × 3 array with the L*, a*, and b* codes corresponding to the referenced RGB code.
ctype takes the values “lab” (default), which uses the D65 (1964) standard, and “labx”, which uses the D65 (1931) standard. Actually, ctype can also take the value “rgb”, in which a 1 × 3 array with the red, green, and blue codes corresponding to the referenced RGB code is returned.
Examples
Figure 1 illustrates the use of these worksheet functions. Column G displays the formula in column C.
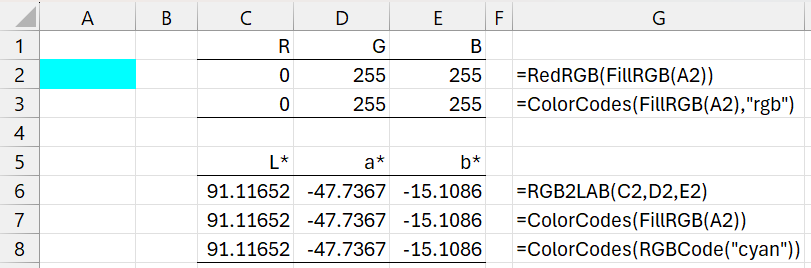
Figure 1 – Color conversion
Worksheet Functions
Real Statistics Functions: The Real Statistics Resource Pack provides the following worksheet functions to calculate the squared distance between two colors.
RGBDistSq(rgb1, rgb2, ttype) = the squared distance between the colors with RGB codes rgb1 and rgb2
ColorDistSq(color1, color2, ttype) = the squared distance between the names colors color1 and color2
Here, ttype takes the following values:
- ttype = 0 (default): Alternative 1 weighted RGB Euclidean distance squared
- ttype = 1: Alternative 2 weighted RGB Euclidean distance squared
- ttype = -1: Unweighted RGB Euclidean distance squared
- ttype = 2: L*a*b* Euclidean distance squared
We believe that ttype = 2 yields the best results, in terms of human visual perception.
Examples
Figure 2 provides some examples of the use of these worksheet functions.
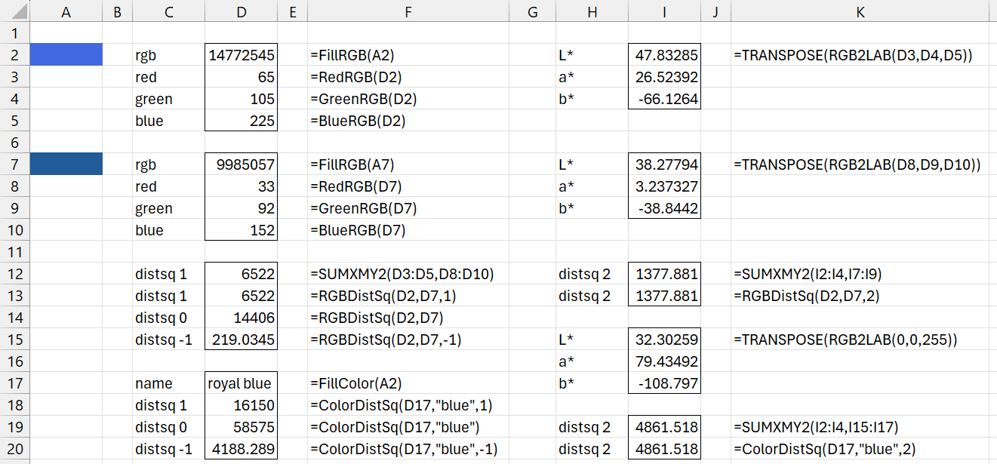
Figure 2 – Color distance examples
Enhanced Worksheet Functions
Real Statistics provides the following expanded versions of three of the functions described in Colors.
FillColor(R1, approx, ttype) returns the fill color of R1 as text. If approx = 0 (default), an exact match among the 128 named colors must be found; otherwise, “unknown” is returned. If approx = 1, then the closest of the 128 named colors is returned. approx = -1 is equivalent to approx = 1, except that when there is an exact match, the next closest of the 128 named colors is returned.
Here, “closest” means the named color with the smallest distance from the color in R1 based on the specified ttype distance measurement.
FontColor(R1, approx, ttype) returns the font color of R1 as text, using approx and ttype as for FillColor.
GetColor(rgb1, approx, ttype) returns the named color with RGB code rgb1, or the closest such named color, depending on approx and ttype, as for FillColor.
Examples
We show some examples of these worksheet functions in Figure 3.
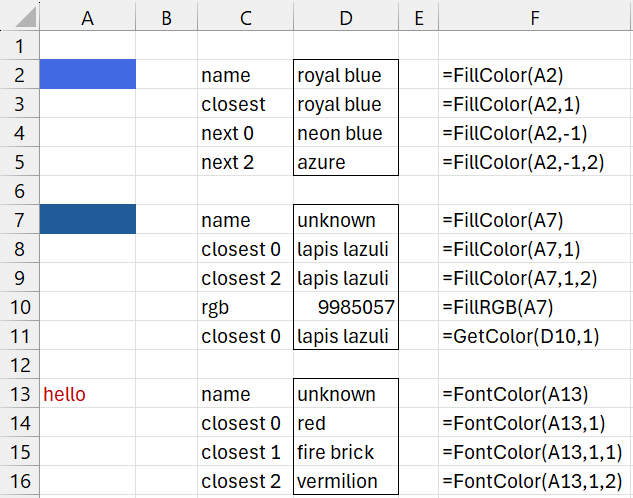
Figure 3 – Closest named color
Range A2:F23 of Figure 4 provides a partial list of named colors (taken from Figure 1 of Colors). For each color, range H2:M23 shows the next closest named color using ttype = 0 (i.e. RGB coding), and range O2:T23 shows the next closest named color using ttype = 2 (i.e. L*a*b* coding).
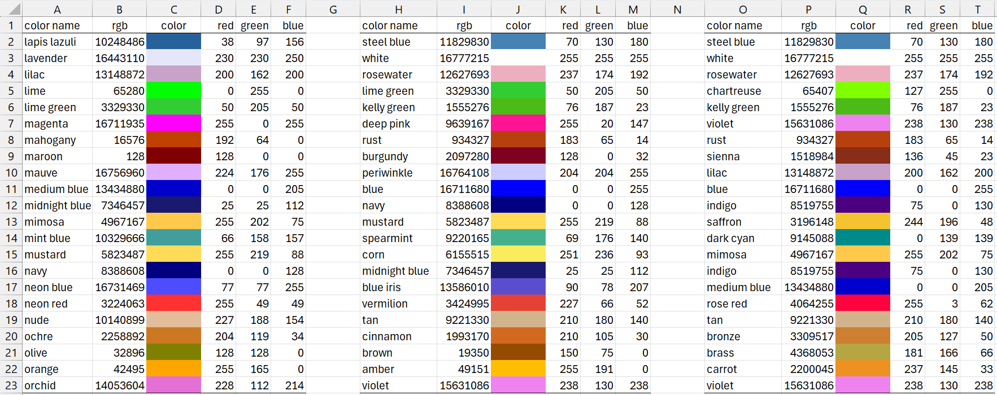
Figure 4 – Closest named colors (partial list)
E.g. cell H2 contains the formula =FillColor(C2,-1) and cell O2 contains the formula =FillColor(C2,-1.2). We inserted the colors in column J (and similarly in column Q) using the Color Assignment data analysis tool by inserting I2:I23 in the Input Range and J2 in the Output Range of the dialog box, as explained in Colors.
Caution
There is an error in the calculation of distance squared when ttype = 2. The L*, a*, and b* components have incorrectly been treated as integers, which usually leads to a small error in the distance measurement. This error will be corrected in the next Real Statistics release.
Links
Examples Workbook
Click here to download the Excel workbook with the examples described on this webpage.
References
Microsoft Office (2018) Add or change background color of cells
https://support.microsoft.com/en-us/office/add-or-change-the-background-color-of-cells-ac10f131-b847-428f-b656-d65375fb815e
Wikipedia (2026) CIELAB color space
https://en.wikipedia.org/wiki/CIELAB_color_space
Wikipedia (2026) CIE 1931 color space
https://en.wikipedia.org/wiki/CIE_1931_color_space
Easy RGB (2026) Color math and programming code examples
https://www.easyrgb.com/en/math.php