General Overview
You can access the Real Statistics data analysis tools by pressing Ctrl-m or via the Quick Access Toolbar or Add-Ins ribbon (as described in Accessing Real Statistics Tools). One of two dialog boxes will appear which lists all the available supplemental data analysis tools (see Figures 1 and 2).
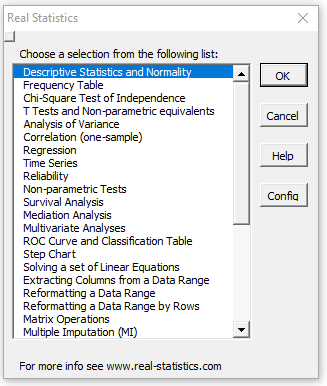
Figure 1 – Original Real Statistics data analysis tools main menu
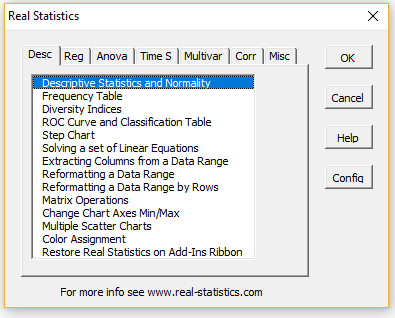
Figure 2 – Multipage data analysis tools main menu
Choosing a data analysis tool
Next, choose one of the data analysis tools from this list. A dialog box will now appear which is similar to that presented in Figure 2 of Excel’s Data Analysis Tools. Suppose, by way of example, that you choose the Matrix Operations data analysis tool from the menu in Figure 1 (or the Misc tab in Figure 2). You will now be presented with the dialog box shown in Figure 3.
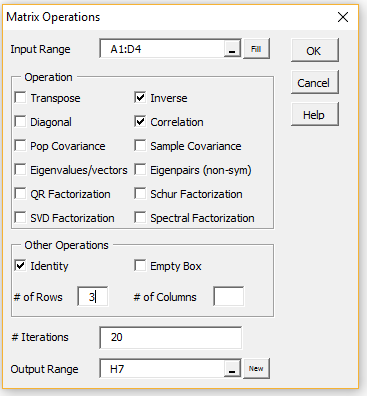
Figure 3 – Dialog box for Matrix Operations
Input Range
The Input Range consists of the Excel range where the data elements to be analyzed are stored. Suppose, by way of example, this data consists of a 4 × 4 array shown in Figure 4.
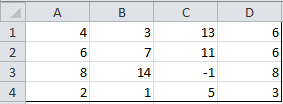
Figure 4 – Sample input range
You can insert the range A1:D4 in the Input Range field. Alternatively, you can can highlight the range A1:D4, and it will automatically be inserted into the Input Range field.
The approach is slightly different in the Mac environment. See Using Real Statistics Tools on a Mac.
In this example, the input range is quite small, but when using a data range with many rows, it can be time-consuming and tiresome to highlight the entire range. Instead, you can highlight just the first row of the desired data range (A1:D1 above) and then click on the Fill button right next to the Input Range field. The range will then be modified to include all the rows down to the last row above a row with only empty cells (A1:D4 above).
Filling in other dialog box fields
Next, click on the checkbox for all the matrix operations you desire (Inverse, Correlation, and Identity in the example above). The selected operations would then be applied to the matrix in the Input Range (except for Identity and Empty Box), with the results being displayed starting at the cell in the Output Range field.
If the Identity option is selected, then the value entered in # of Rows determines the size of the identity matrix displayed. If the Empty Box option is selected, then the values entered in # of Rows and # of Columns determine the size/shape of the empty box that is displayed.
Finally, if the Eigenvalues/vectors (for symmetric matrices), Eigenpairs (for non-symmetric matrices), QR Factorization, Schur Factorization, SVD Factorization, or Spectral Factorization option is chosen then the # of Iterations field may be filled in with the number of iterations used in the algorithm employed (default 20).
Output Range
The Output Range is automatically filled in with the address of the currently selected cell in the active worksheet (H7 in the example above), as described below. This value can be manually overridden.
The Output Range must be on the same worksheet as the Input Range, although if the Output Range field is empty, then the output will be displayed on a new worksheet in the same workbook (similar to the New Worksheet Ply option described in Figure 2 of Excel Data Analysis Tools). You can also accomplish the same thing by clicking on the New button next to the Output Range field.
Once you have filled in all the fields, you should press the OK button.
If you click on any cell in the current worksheet before using any of the data analysis tools, that cell is used as the default location of the output. However, if you highlight more than one cell, then the resulting range is used as the default Input Range (or if there is more than one input range, then the first input range defaults to the highlighted range). In this case, the Output Range defaults to blank, which means that the output will be written to a new worksheet. You can manually override any of these defaults.
Help
If you place the mouse pointer over any element in the dialog box (Figure 3), you will receive information about how to use that element (tooltip). If you need further information, click on the Help button (shown in Figure 3). The resulting message for Matrix Operations is displayed in Figure 5.

Figure 5 – Help message for Matrix Operations
Return to Main Menu Option
When one of the Real Statistics data analysis tools has completed its task, users can be prompted to choose another data analysis tool (which usually means that the dialog box in Figure 1 or 2 is redisplayed). Whether or not to prompt for another data analysis tool or terminate is configurable.
The default is to terminate after one data analysis tool has completed execution (although the Color Assignment and Statistical Power and Sample Size data analysis tools are exceptions).
If you always want to see a prompt for another data analysis tool, then you need to click on the Config button on the main dialog box and then check the Return to main menu option on the Configuration dialog box that appears (see Figure 2 of Real Statistics Main Menu). You can click on the Config button to change this option at any time.
Percentage Option
Note that a number of the Real Statistics dialog boxes contain an Alpha field, which contains the significance level for the desired statistical test. This value defaults to 0.05 (or 0,05 on systems that use a comma instead of a period for the decimal symbol), although you can change it to some other value (e.g. 0.01).
You can optionally check the Use Percentage option on the Configuration dialog box (as shown in Figure 2 of Real Statistics Main Menu). In this case, the label Alpha will be replaced by Alpha %, and its default value will be shown as 5 (representing 5%). You can override the default value by entering some other whole number (e.g. 1 representing 1%). This approach has the advantage that no decimal number is necessary. For some users, this is important since on some Excel implementations, there may be a problem when using the 0,05 notation instead of 0.05.
Whether or not you use the Use Percentage option, you can always enter a value of 0 for Alpha and then override this value in the output.
Links
References
Blogmines (2023) How to change the decimal separator in Excel
https://blogmines.com/how-to-change-the-decimal-separator-in-excel-2010/