Real Statistics provides capabilities similar to those provided by Excel’s Data Table. Unlike Excel’s version, the Real Statistics version is accomplished using worksheet functions. Also, the Real Statistics approach is often simpler and easier to implement.
We now show how to provide the various Data Table features using these Excel functions. We start by providing a solution to Example 1 of Excel’s Data Table Facility.
One-variable Example
Example 1: Create a data table for the cdf of the gamma distribution when alpha = 1 and beta = 2.
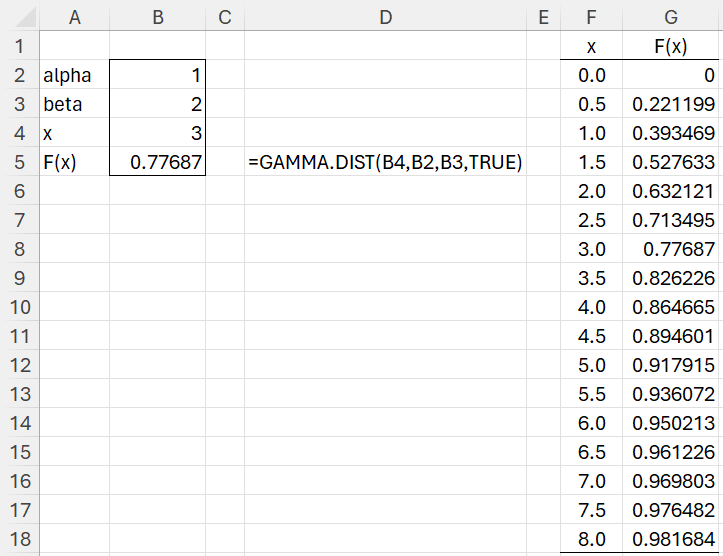
Figure 1 – One-variable Data Table
Columns A through F of Figure 1 are filled in just like in Example 1 of Excel’s Data Table Facility.
To fill in the values in range G2:G18, you just need to highlight range G2:G18, enter the formula =EVALX(F2:F18,B4,B5), and then press Ctrl-Shift-Enter. If you are using Excel 365, it is even easier. You can simply click on cell G2, enter the formula =EVALX(F2:F18,B4,B5), and then press Enter.
=EVALX(F2:F18,B4,B5) is a true worksheet formula that can be used just like other worksheet formulas.
Whereas the output in G2:G18 for Example 1 of Excel’s Data Table Facility must be placed in the next column to the right of the input F2:F18 when using Excel’s Data Table, the output from EVALX can be placed anywhere.
Shape of the Data Table
As we saw in Example 3 of Excel’s Data Table Facility, the input for Excel’s Data Table capability can also take the form of a row range, in which case the output must be placed in the row below or to the input. The input (and output) can only be a row range or a column range. The input range for EVALX can take any rectangular shape; the output will have the same shape and size. This is shown in Figure 2.

Figure 2 – Rectangular shape
Worksheet Function
Real Statistics Function: The Real Statistics Resource Pack provides the following array function, where Rd is any cell range containing numeric data, Rx is a cell address that serves as the placeholder for the variable x, and Rf is a cell that contains a numeric formula f(x) in one variable
EVALX(Rd, Rx, Rf): returns an array of the same shape and size as Rd, whose values are f(a) for every a in Rd, where f(x) is the formula defined in cell Rf and x is the variable defined by Rx.
The formula in Rf can reference Rx (and any cells that don’t make reference to Rx or Rf, directly or indirectly).
Using an intermediate formula
Example 2: Create a data table for the function f(x) as described in range A2:B4 of Figure 3 for the data in range F3:F12.
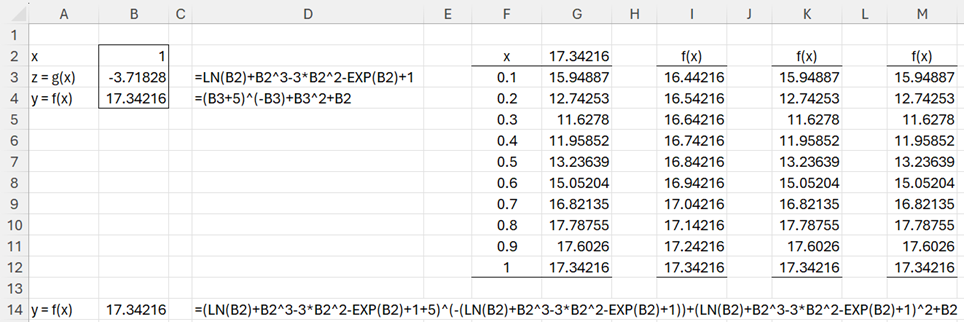
Figure 3 – Example using an intermediate formula
This time, we are looking at a function f in cell B4 that seems to have two variables, whose placeholders are B2 and B3 (as seen in cell D4). But since B3 contains a formula that is a function of just one variable, with placeholder B2 (as seen in cell D3), essentially, f is a function of just one variable, f(x), with one placeholder B2.
If we use Excel’s Data Table capability with =B4 placed in cell G2 and =B2 inserted in the Column input cell field of the Data Table dialog box, then range G3:G12 will be filled with the values shown in Figure 3.
If, instead, we place the Real Statistics array formula =EVALX(F3:F12,B2,B4) in range I3:I12, we don’t get the correct answers. This is because the EVALX function doesn’t know that there is an intermediate formula. We could redefine f(x), as shown in D14, and use the formula =EVALX(F3:F12,B2,B14). In this case, we do get the correct result, as shown in range K3:K12, but this entails that we eliminate the intermediate formula g(x), which results in a very long formula in cell B14.
To avoid this problem, we can use a version of the EVALX function that explicitly identifies the intermediate function g(x). This time we place the formula =EVALX(F3:F12,B2,B3, B4) in range M3:M12, resulting in output that matches the results from Excel’s Data Table in column G.
Revised Worksheet Function
Real Statistics Function: The EVALX function described above can take a 4th optional argument Ri, which is the address of a cell containing an intermediate formula. Note that the formula in Rf can make reference to Rx and Ri (and any cells that don’t make reference to Rx, Ri, or Rf, directly or indirectly). The formula in Ri can make reference to Rx (and any cells that don’t make reference to Rx, Ri, or Rf, directly or indirectly). The new format for this worksheet function is:
EVALX(Rd, Rx, Rf, Ri)
Example with two functions
Example 3: Create a data table for the functions f(x) and g(x) from Example 2 for the values of x from Example 2.
The approach using Excel’s Data Table capability is similar to that described in Example 2 of Excel’s Data Table Facility. The output is shown in columns G and H of Figure 4.

Figure 4 – Example with two functions
You can obtain the same approach using Real Statistics by placing the array formula =EVALX(F3:F12,B2,B4,B3) in J3:J12 and the array formula =EVALX(F3:F12,B2,B3) in K3:K12.
Two-variable Examples
Click here for the Real Statistics versions of the two-variable Data Table.
Links
Examples Workbook
Click here to download the Excel workbook with the examples described on this webpage.
Reference
Cheusheva, S. (2023) How to make and use a data table in Excel.
https://www.ablebits.com/office-addins-blog/data-table-excel-one-variable-two-variable/