Introduction
Excel provides a Data Table capability as one of its What-If Analysis tools. This capability allows you to see how changes to one or two variables affect the output from formulas in a spreadsheet. When this facility is used, Excel places a pseudo-function TABLE in the spreadsheet.
On this webpage, we will explain the one-variable Data Table via a series of examples. See Two-Variable Data Table for a description of the two-variable version.
Example
Example 1: Create a data table for the cdf of the gamma distribution when alpha = 1 and beta = 2.
We start by filling in the alpha and beta values in cells B2 and B3, and a placeholder for the x variable in cell B3. We then calculate the cdf F(x) at this variable in cell B5 using the formula shown in D5.
Next, we fill in the values of x that we want to evaluate in column F.
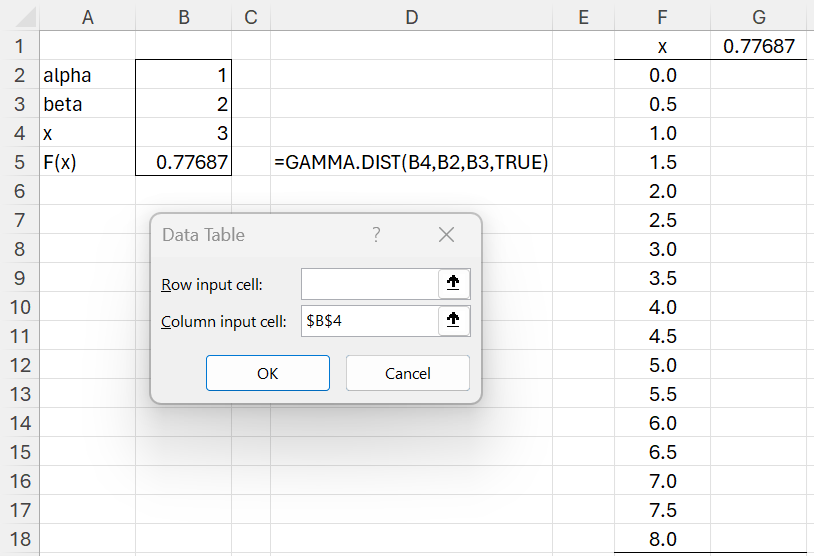
Figure 1 – Set up for a Data Table for one variable
Now we enter the formula =B5 in cell G1. This will tell Excel’s Data Table capability where to find the formula that calculates F(x) for each of the x values in the column range F2:F18.
Data Table dialog box
We next highlight range F1:G18 and then select Data > What-If Analysis > Data Table… from the ribbon, which brings up the dialog box shown in Figure 1. Since our x values are arranged in a column, we click on the Column input cell field and then select cell B4, i.e. the location of the placeholder for the x variable in the formula F(x) in cell B5 (as pointed to in cell G1). Now Excel knows where to find the formula for F(x) and knows where to find the placeholder for x.
Output
When you click on the OK button, the corresponding F(x) values are filled into column G, as shown in Figure 2.
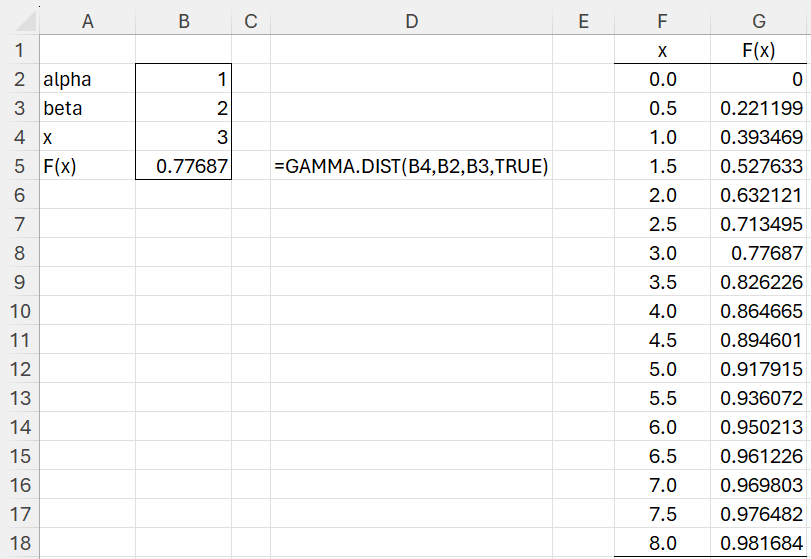
Figure 2 – Data Table for one variable
As remarked above, range G2:G18 will contain the pseudo array formula {=TABLE(, B4)}. This is not a real Excel formula since you can’t change it or move it, nor can you do most of the other things you can do with a true Excel formula.
Chart
If we like, we can highlight range F2:G18 and select Input > Charts|Scatter with Smooth Lines and Markers to obtain the chart shown in Figure 3.

Figure 3 – Gamma distribution chart
Custom Formatting
One further thing needs to be explained. Cell G1 in Figure 2 still contains the formula =B4, and so the value .77687 will still appear in this cell. We have replaced this with the text F(x) on the spreadsheet by adding a custom format to this cell. This is done by clicking on G1 and then selecting Home > Number. When the Format Cells dialog box appears, click on Custom and then enter F(x), as shown in Figure 4.

Figure 4 – Creating a Custom format
After clicking on the OK button, the cell G1 will appear as shown in Figure 2. Note that the formula in cell G1 has not changed and will remain =B5.
Example with two functions
Example 2: Repeat Example 1 with both the pdf and cdf of the gamma distribution (see Figure 5)
The approach is the same as for Example 1, with only two differences, namely
- You place =B5 in cell G1 (just as before) and =B6 in cell H1 (to define both functions)
- Before you select Data > What-If Analysis > Data Table… from the ribbon, you highlight the range F1:H18. Just as in Example 1, you insert B4 in the Data Table dialog box.
The output is shown in columns G and H of Figure 5.

Figure 5 – Data Table with two functions
Row range example
Example 3: Repeat Example 1 with the data contained in a row range (see Figure 6).
The approach is the same as for Example 1, with only three differences, namely
- You place =B5 in cell D3
- Before you select Data > What-If Analysis > Data Table… from the ribbon, you highlight the range D2:M3.
- Just as in Example 1, you insert B4 in the Data Table dialog box, but this time you place it in the Row input cell
The output is shown in E3:M3 of Figure 6.
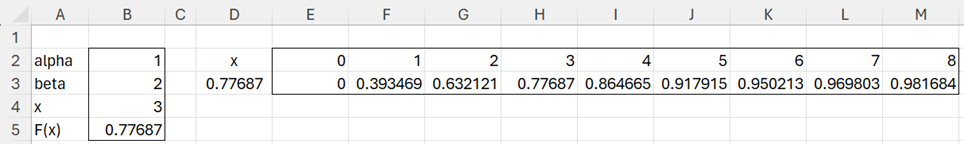
Figure 6 – Data Table (row version)
Links
Examples Workbook
Click here to download the Excel workbook with the examples described on this webpage.
Reference
Cheusheva, S. (2023) How to make and use a data table in Excel.
https://www.ablebits.com/office-addins-blog/data-table-excel-one-variable-two-variable/