Data Analysis Tool
Real Statistics Data Analysis Tool: The Extract Columns from Data Range data analysis tool supplied by the Real Statistics Resource Pack enables you to select a subset of columns from a data range. It is especially useful when data for only certain random variables are to be used in a particular analysis. The use of this tool is illustrated in Example 1.
Example 1: Extract the Poverty, Infant Mort, Doctors, Traf Deaths, and Income columns from the data range A3:J22 in Figure 1.
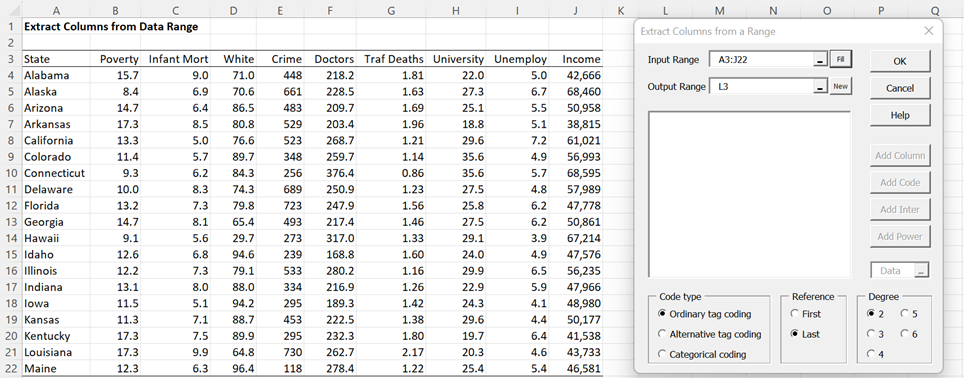
Figure 1 – Extract Columns from Data Range dialog box
Initial dialog box
Press Ctrl-m and choose the Extract Columns from Data Range option (from the Desc tab or the main menu if using the original user interface). Fill in the dialog box that appears with the Input Range and Output Range as shown in Figure 1, and then click on the OK button. You can ignore the Code type and Degree options for now.
Note that the data in the Input Range must contain unique column headings.
Revised dialog box
The dialog box will now change as shown on the right side of Figure 2. Highlight the first three columns on the list by clicking on State and then, while pressing down on the Shift key, click on Infant Mort. Next, press the Add Column button. The State, Poverty, and Infant Mort columns are now copied to the output as shown.
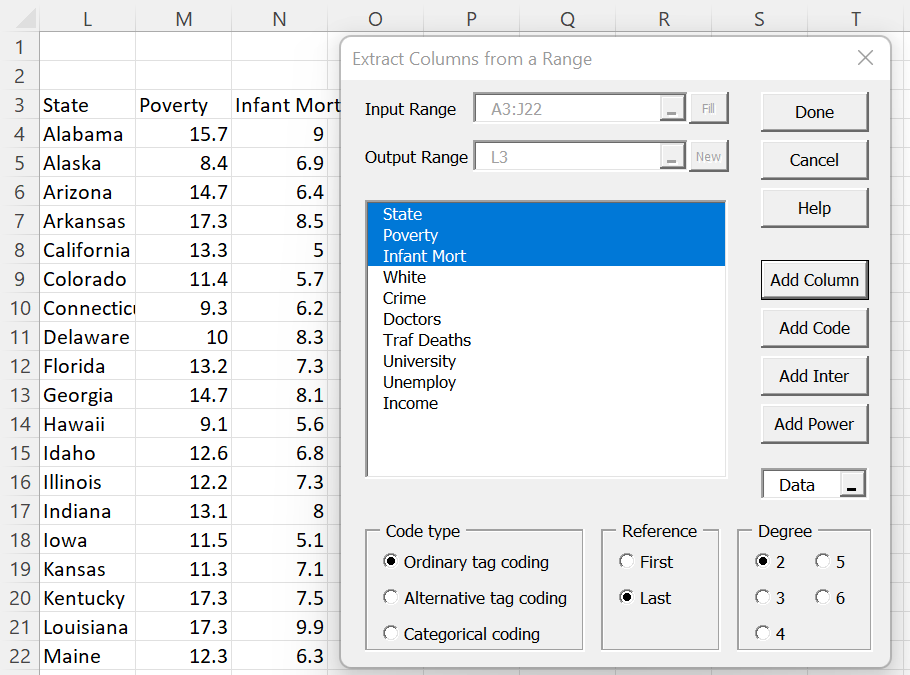
Figure 2 – Copy Columns from a Data Range
You can copy the remaining columns of interest by clicking on Doctors, Traf Deaths, and Income in the list while holding down the Ctrl key and then pressing the Add Column button. Finally, click on the Done button to close the dialog box. The result is shown in Figure 3.
The Add Code, Add Inter, and Add Power buttons are explained on the following web pages:
- Add Code: Categorical Coding for Regression
- Add Inter: Interaction
- Add Power: Polynomial Regression Analysis Tool
Looking at the data
If, while performing any of these steps, you need to look at the Excel workbook, you can simply click on the Data button on the lower right-hand side of the dialog box. You are advised not to change anything in the workbook when you do this.
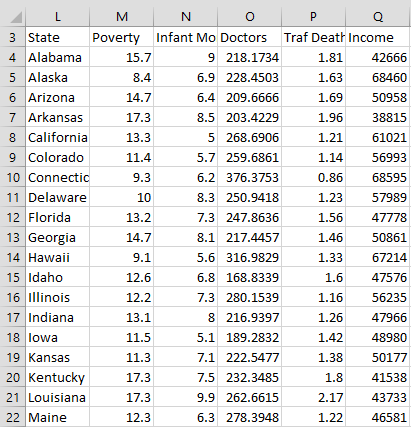
Figure 3 – Output from Extract Columns data analysis tool
Worksheet Function
Real Statistics Function: You can also use the following array function from the Real Statistics Resource Pack to select columns from an array or data range.
SelectCols(R1, selections) – returns an array with the columns from R1 specified in the string selections in the order in which they appear. selections specifies a list of column indices separated by commas. Not all columns in R1 need to be included in the output; some columns can be included multiple times, and the order of the columns can be different from how they appear in R1.
SelectCols(R1, selections, sortcol) – returns an array with the columns from R1 as specified for SelectCols(R1, selections), except that the rows in the output are sorted based on the elements in the sortcolth column of the output, in a fashion similar to the Real Statistics function QSORTRows.
If, for example, R1 is a 4 × 5 array, then selections could take the form “2, 3, 2”. The output from SelectCols(R1, “2,3,2”) would then consist of the 2nd, 3rd, and 2nd columns of R1 in that order, where the 2nd column appears twice. In this case, SelectCols(R1, “2,3,2”, 2) would yield the same output in sorted order based on the elements in the 2nd column of the output (which is the 3rd column of R1).
Note that SelectCols plays a similar role to the Excel 365 function CHOOSECOLS (see Excel Reformatting Functions).
Using this worksheet function
Example 2: Create a new range consisting of the 2nd, 3rd, and 1st columns of the data in range A3:D14 of Figure 3. Also, create a new range which changes the order of the columns of the data in range A3:D14 to the 3rd, 2nd, 1st, and 4th columns in that order and sorts the rows of this new range based on the 3rd column of A3:D14 (i.e. the 1st column of the new range).
The first of these ranges is shown in range F3:H14 of Figure 4 and is calculated by the array formula =SelectCols(A3:D14,”2,3,1”). The second is shown in range J3:M14 and is calculated by the array formula =SelectCols(A3:D14,”3,2,1,4”,1).
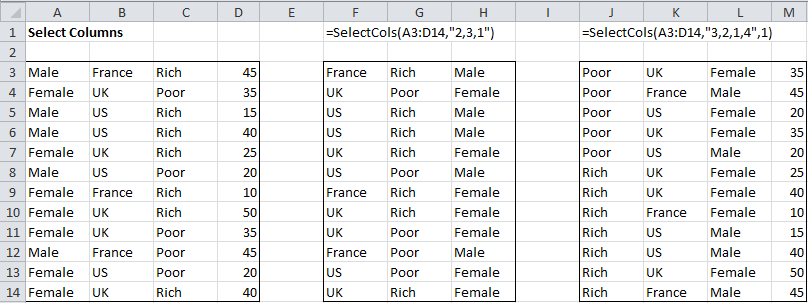
Figure 4 – Selecting columns from a data range
Links
↑ Data conversion and reformatting
Examples Workbook
Click here to download the Excel workbook with the examples described on this webpage.
References
Howell, D. C. (2010) Statistical methods for psychology (7th ed.). Wadsworth, Cengage Learning.
https://labs.la.utexas.edu/gilden/files/2016/05/Statistics-Text.pdf
Can the code be modified such that the sorting number “1” sorts first extracted column ascending and “-1” sorts first extracted column descending ?
Jeff,
There are so many possibilities as to what people might want to do. I decided to keep things simple in the Extracting Columns data analysis tool. You can always sort the results in any way you want by using Excel’s sorting capabilities or Real Statistics’ sorting capabilities. See
https://real-statistics.com/excel-environment/sorting-filtering/
https://real-statistics.com/excel-capabilities/sorting-and-filtering-functions/
https://real-statistics.com/real-statistics-environment/data-conversion/sorting-and-removing-duplicates-by-rows/
Charles
Thanks for a great tool.
I am extracting columns with different numbers of items in the columns. When I output, the excess spaces in the shorter columns are filled with zeros. Easy enough to clear, but any way around that? Cheers! J
J,
Good point. I need to fix this. I will do so in the next release of the software, which should be available within the next week to 10 days.
In the meantime, you can do the following. Suppose, for example, your data is in the range A1:E20. You can place the formula =IF(A1=””,”x”,A1) in cell G1, and then highlight the range G1:K20 and press Ctrl-R and Ctrl-D. This will replace all the empty cells by “x”. If “x” is used elsewhere in range A1:E20, then you some other character. Now perform the Extracting Columns from a Data Range data analysis tool on range G1:K20.
As I said, I will fix this shortly. Thanks for identifying this problem.
Charles