Introduction
Categorical independent variables can be used in a regression analysis, but first, they need to be coded by one or more dummy variables (also called tag variables). Each such dummy variable will only take the value 0 or 1 (although in ANOVA using Regression, we describe an alternative coding that takes values 0, 1, or -1).
Example
Example 1: Create a regression model for the data in range A3:D19 of Figure 1.

Figure 1 – Coding of categorical data
Age is a continuous random variable, while Party affiliation and Gender are categorical random variables. There are three possible values for the Party affiliation variable and two possible values for the Gender. In general, if the original data has k categorical values, the model will require k – 1 dummy variables.
Since Gender takes two values (Male and Female), one dummy variable, called Gender1, is sufficient to code Gender, defined as follows:
Gender1 = 1 if Gender is Male and Gender1 = 0 otherwise (i.e. if Gender is Female)
Since Party takes three values (Rep, Dem, Ind), two dummy variables, called Party1 and Party2, are needed to code Party, defined as follows:
Party1 = 1 if Party is Rep and Party1 = 0 otherwise
Party2 = 1 if Party is Dem and Party2 = 0 otherwise
The resulting coding is as shown in range F3:J19 of Figure 1.
Regression
We can now perform regression analysis on this range. The output from the Real Statistics Linear Regression data analysis tool on this input is shown in Figure 2.
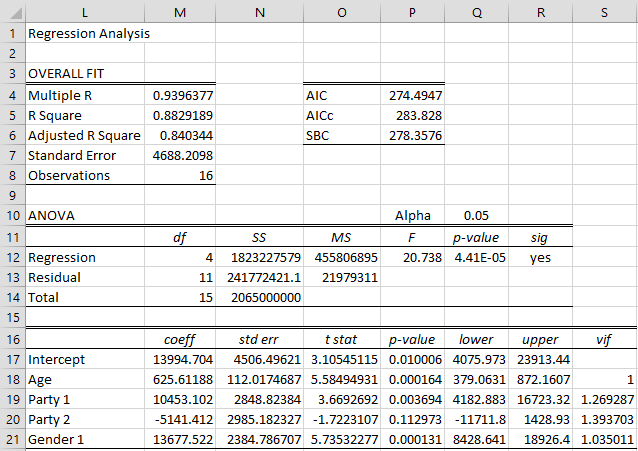
Figure 2 – Regression with categorical data
The model can predict the income of a 25-year-old woman who is a Democrat, provided you recognize that the coding is Age = 25, Gender1 = 0, Party1 = 0, Party2 = 1. From Figure 3, you can see that the model forecasts that this person would have an income of 24,494 (cell J22) as calculated by the formula =TREND(J4:J19,F4:I19,F22:I22). Similarly, we see that the model forecasts that a 40-year-old man who is Independent will have an income of 52,697 (cell J23).

Figure 3 – Forecasting with categorical data
Data Analysis Tool
You can use the Real Statistics Extract Columns from a Data Range data analysis tool to automate the coding of categorical variables.
For example, to create the coding for the Party and gender variables from Example 1, press Ctrl-m and select Extract Columns from a Data Range from the menu. Now enter A3:D19 into the Input Range in the dialog box (as shown on the right side of Figure 4) and press the OK button.
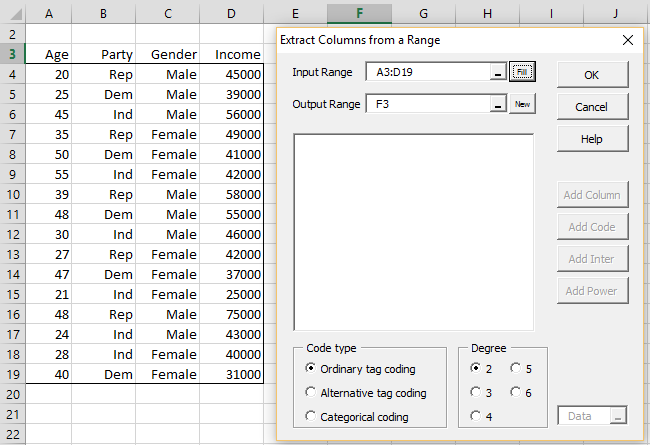
Figure 4 – Coding the Party variable via the data analysis tool
Now, select Age in the list box and press the Add Column button (to copy the Age data to the output). Next, select Party from the list box and press the Add Code button (as shown on the right side of Figure 5). Since the Ordinary coding option was selected, the 0, 1 coding is used.
The result is shown on the left side of Figure 5. As you can see, the Party#1 and Party#2 variables have been added to the worksheet.

Figure 5 – Coding of the Party variable
Now click on Gender from the list and press the Add Code button and, finally, click on Income from the list and press the Add Column button. The output is as shown in range F3:J19 of Figure 1. You can now perform multiple regression on the X data in range F3:I19 and Y data in range J3:J19 using the Linear Regression data analysis tool.
Examples Workbook
Click here to download the Excel workbook with the examples described on this webpage.
References
Howell, D. C. (2010) Statistical methods for psychology (7th ed.). Wadsworth, Cengage Learning.
https://labs.la.utexas.edu/gilden/files/2016/05/Statistics-Text.pdf
Sundell, A. (2021) Regression analysis with dummy variables
https://www.stathelp.se/en/dummy_en.html
Hello Charles.
User
I put all my data coded manually 1,2,3,4 in MS excel already.
So its fine if i directly run the data analysis in MS Excel.
Or I have to code the categorical data using MS excel only first before running the data analysis.
Hello Amisha,
You can certainly use MS Excel for regression analysis. If you use the coding 1,2,3,4 then the data has an order. If the data isn’t ordered, then you shouldn’t use this coding and instead, you should use the categorical coding.
Charles
thank you very muchhh! i am getting prepared for a project and i was so confused how to work with my categorical data! this helped me a lot! love from turkey, cheers,
hi.. example.. effect of gender or (any single explanatory categorical variable) on pass/fail (or a any single categorical variable. any suggestion on an application? very grateful
Hi James,
Sorry, but I don’t understand your question.
Charles
hello and thanks,,
scenario….
regression application
2 variables both categorical
independent is gender m/f
dependent is pass/fail licensing exam
what would an excel spreadsheet look like before applying the regression app?
can this example be performed on software
thanks, charles
Hello James
The data might look something like this
x..y
0..1
1..1
1..1
1..0
0..1
0..0
1..0
Multiple linear regression might not be the best way to model this data. Depending on what you plan to do with the model, you might use logistic regression or chi-square test or Fisher’s exact test, etc.
Charles
Dear Charles,
can you please tell me whether a regression models exists for this situation where a dependent variable is affected from the independent variables differently whether it belongs to a category or not. I built an example to check how the multi regression model reacts but as expected it doesnt produce anything usable . I wanted to test before applying to my data pool.
Here the example to illustrate: Men(x1) with higher income(y) drive powerful cars(x2). For women, it is exactly the opposite. The smaller the cars they drive, the higher their income. Now if we take the whole population, correlations are almost null, but if we compute correlations or regression on a women and men samples, they are almost perfect.
In this case it is easy to identify the different patterns, depending on sex, and build then 2 regression lines for the 2 categories. But is there any automated process, since identifying categories, not just two, in large data is almost impossible.
sex M=1 W=0 engine power Income KEUR
male 1 10 2
male 1 10 3
male 1 15 2
male 1 30 5
male 1 60 8
male 1 40 4
male 1 90 10
male 1 90 10
male 1 70 9
male 1 20 1
female 0 90 2
female 0 80 3
female 0 70 2
female 0 50 5
female 0 20 8
female 0 19 4
female 0 5 10
female 0 8 10
female 0 10 9
female 0 80 1
Michael,
You ask a very interesting question that I have thought about for the past couple of weeks, but I don-t know of an automatic process to address this issue.
Charles
Hey Charles!
What if I have to analyse age groups and their subsequent impact on income? Do I have to take quartiles of my age range, find the average wage of each quartile age group and enter their values into the regression table? Or would it be another set of dummy variables?
Thank you so much!
Kind regards,
Jen
Jen,
Age is numeric and so you shouldn’t use dummy variables since they don’t capture the order.
You can simply use Age as a numeric value or you can use intervals of ages (based on the mean or even 1 = ages < 20, 2 = ages 21 to 40, etc. or something similar. Charles
Hi Charles
I have some experimental data that needs polynomial regression, and would like to use the coding method described here. However, coding only changes the intercept, and the regression model does not fully describe the behaviour. Could I also use coding to apply to both the intercept and to one of the polynomial terms?
In terms of the example in this page, it would be similar to saying that
Income = function(Age, Age^2, Party, Gender)
Where the categorical variable Gender would not only impact the Intercept, but also Age. The objective here would be to see if Income was not only affected by Gender, but also your Gender*Age.
Thank you, Chris
Chris,
If I understand the situation correctly, you have one continuous independent variable Age and two categorical independent variables Gender and Party. If this is the case, then you use the dummy coding for Party and Gender, but use a linear regression model of form:
Income = b0 + Age * b1 + Age^2 * b2 + Party * b3 + Gender * b4 + Gender*Age * b5.
You could also add terms such as Party*Age, etc. Assuming Gender takes two values Female = 1 and Male = 0, then essentially Gender in the equation really means Female. If Party takes three values (Dem, Rep, Ind), then Party is really two variables Rep and Ind (Dem occurs Rep = 0 and Ind = 0).
Charles
HI,
How can the same thing be done in excel?
The values in columns H and I of Figure 1 can be obtained in the following way:
1. Insert the formula =IF(B4=”Rep”,1,0) in cell H4 and =IF(B4=”Dem”,1,0) in cell I4
2. Highlight the range H4:I19 and press Ctrl-D
Charles
With dummies, for each category of you model you receive a weight, a real floating point value. This value is multiplied by the dummy and added to your regression value.
So effectively, each quality within a categorical variable becomes a column which adjusts your regression up or down some fixed amount, for a value of 1 or not at all for a value of Zero. The adjustment amount, the weight is ‘the average affect’ for that quality of the categorical variable.
In reality, ALL off the categorical dummy variables are included in your regression model. When the 0 or 1 values that are entered for an observation are multiplied by the weight, 1 values return the weight to be added, multiplying by zero returns zero, so for categorical columns where there is a Zero (meaning not a member of this categorical quality) no adjustment is given.
This is where the polynomial is getting sticky. The magic in Zero and One are that they remain Zero and One when squared, cubed or raised to any other power. So, you in effect are repeating your categorical variables multiple times, but not adding a ‘multiplier’ to them because your powers are applied prior to calculating a weight and they will remain 0 or 1.
Depending somewhat on the model type (there are ways to reduce bias and collinearity which might change the architecture of the model and your results) you get a result that reflects the polynomials of your continuous values and either the simple intercept adjustment for the True class in each category or a smoothed version of that same model because the penalties are also applied to the weighted-adjusted value, which is either the weight or zero.
Basically you break up the weight of your categories across how ever many polynomials you apply them to, which you can test.
If you build a simple regression model with one X (continuous) and one Y (also continuous) then build the same model with TWO copies of the exact same X-variable (use a different name for the second copy) you used in the first model, you will get the same predicted results. Because no variation is created by adding the second identical variable, no further distribution of weights is made. You get the same end prediction.
That being true, you can see where reducing the polynomial versions of the categorical observations to zero (removing them) or 1 repeating that initial instance, should work out to be the same. You spread the influence of Party_1 =1 across all the polynomial instances of your categories, but you do not gain a more refined prediction. However you will still accrue the influences of the continuous variables across the polynomials.
If you use interaction terms with binary values, the same thing happens, you get the value of the continuous variable when the category is One and nothing when it is zero, so you are simply adding a second copy of that continuous variable.
So, this leads you the question…does this make sense? In essence, this method of modeling lends preference to continuous variables. Are you biasing your model, or not? Does it perform better or not? That is a bigger question than you have asked here, but something to consider!
Hi Dr. Zaiontz
In your example for categorical variables, do I understand correctly that the predicted income is given by the formula:
income-hat = 13994.704 + 625.61188*Age + 10453.102*Party1 – 5141.412*Party2 + 13677.522*Gender1
That is, if Party = Rep, then 10453.102 is added to get income-hat, and if Party = Dem, then 5141.412 is subtracted to get income-hat. If Party = Ind then Zero is added to get income-hat
Thanks!
Hello Arvind,
Yes, you understand it correctly.
Charles
Charles
Everything is working fine. I had some trouble running the Macro but now its fixed.
Thanks for the help.
I will be running some big aviation data soon.
Is there any limitation on the number of items that be parsed ( for example here we had 6 parties)?
Thanks.
Dr. Som.
Thanks Charles.
Can you please show me the steps to code Parties Rep, Dem, Ind, Black Lives Matter, All Lives Matter, Green to 1,0,0,0,0,0?
The conversion of Male/Female to 0,1 is straight forward.
Thanks.
Dr. Som.
I don’t understand your question. You seem to have done this in your previous comment.
Charles
Charles
I am not sure it answers my question. I have the following example input data with 6 parties:
Age Party Gender
20 Rep Male
25 Dem Female
45 Ind Male
35 Black Lives Matter Male
50 All Lives Matter Female
55 Green Female
39 Rep Male
48 Dem Male
30 Ind Male
27 Black Lives Matter Female
47 All Lives Matter Female
21 Green Male
I need to convert the data in the following format:
Age Party1 Party2 Party3 Party4 Party5 Party6 Gender
20 1 0 0 0 0 0 Male
25 0 1 0 0 0 0 Female
45 0 0 1 0 0 0 Male
35 0 0 0 1 0 0 Male
50 0 0 0 0 1 0 Female
55 0 0 0 0 0 1 Female
39 1 0 0 0 0 0 Male
48 0 1 0 0 0 0 Male
30 0 0 1 0 0 0 Male
27 0 0 0 1 0 0 Female
47 0 0 0 0 1 0 Female
21 0 0 0 0 0 1 Male
Is that doable?
Thanks for your help.
Dr. Som.
Dr. Som.
Yes, this is doable, except that you need to code Male/Female (e.g. Male is 0 and Female is 1)
Charles
Charles
I need to dummy-code a large number of items in a category. For a particular transaction ( row), there will be on one ‘1’ for a particular item, and all ‘0’s for the other items. Consider there are 6 parties (instead of 3), Party1, Party2, Party3, Party4, Party5, Party6 (in relation to your example above). In a row, there will be only 1, and all other ‘0’s. Is there a way to do that in RealStatistics?
Thanks.
Dr. Som.
Yes, how to do this is explained on this webpage. Also see
https://real-statistics.com/real-statistics-environment/data-conversion/extracting-columns-from-a-data-range/
Charles
I put the data above into Excel 2016 and used the inbuilt Analysis ToolPak (Data Analysis – Regression) to analyse the data. The results were slightly different to those shown on this page. This might be due the degrees of freedom used in the respective analyses. Excel says df (Regression) = 3; your software above has df (regression) = 4. How is df calculated? Is it that there are 4 possible scenarios, calculated as Age(1) x Party (2) x Gender (2) = 4; and, hence, 3 degrees of freedom? (Or am I completely off-track?) Any help is much appreciated. Thanks.
Difference may be due to how you set out data as Party1 and Party2. I just had Party (Dem = 1; Rep or Other = 0) .Will check.
All good now that I use Party1 and Party2. Thanks for the webpage.
Hi
I have following independent variables in the job category –
Student
Retired
Management
Technician
Blue Collar
Service
Unemployed
Housewife
And I have dependent variable deposit – which has two value yes or no
Please kindly advice how to do forecasting for this dataset.
There are 45211 customers (rows)
Hello,
The Jobs variable can be coded as 7 dummy variables.
Since the dependent variable only takes the values yes (1) or no (0), you should probably use logistic regression instead of multiple linear regression.
https://real-statistics.com/logistic-regression/
Charles
Hi Charles, Just a follow up question on this. I am supposed to compare between logistic and linear regression for the same data. When I use dummy variables the columns are more than 16 and excel is throwing an error. How best can i fix this? Thanks
Brighton,
You could use Excel’s LINEST function, which I believe handles more than 16 independent variables.
Alternatively, you can use the Real Statistics Linear REgression data analysis tool. Real Statistics also has support for Logistic Regression.
You can download the Real Statistics add-in to Excel for free from
https://www.real-statistics.com/free-download/real-statistics-resource-pack/.
Charles
Hai there
Im having four predictors from Likert Scale Data with five categories.
My DV is exam scores.
How to create Dummy variable for this? So, each one of the construct/item will have five dummies??
Thinking of using linear Reg.
Please advice.
Thank you
See my previous response.
Charles
Hai there.
Im having 4 predictors, categorical data from likert scale. It has 4 categories.
My DV is exam scores
Please advise. Tq
Nithia.K
Hello Nithia,
For a true categorical variable with 4 categories, you need 3 dummy variables as described at
ANOVA using Regression
A Likert scale is ordinal and the above dummy variable approach doesn’t capture the order. Instead you can simply treat the variable as though it is numeric. E.g. for a Likert scale with 4 categories, you can use the values 0, 1, 2, 3. If this is not the appropriate weighting, then you could use 1, 2, 4, 5 instead. In fact you can use whatever values you think are appropriate. Note that in the first case you are assuming that there is equal distance between any two contiguous values (e.g. 3-2 = 2-1).
Charles
Hi, Charles. Thanks a lot. But i cant understand how the computer gets to know that the party variable has three categories but the gender variable has only two? And is it that you dont agree with the idea of interpreting your results comparatively, ie, relative to the intercept which represents(?) the -1 categories? pls, help.
Hi, the Real Statistics software counts the number of unique values in the input. If this number is 3 then the variable has 3 categories, while if this number is 2 then the variable has 2 categories.
I don’t understand the question you are asking.
Charles
Hi Charles,
Thanks for the informative session regarding the conversion of categorical attributes.
I am currently working on a grocery store dataset using multiple regression to detect the sales. There are few categorical attributes both ordinal and nominal. Out of these 1 or 2 attributes like Item type has n number of categories (eg. milk, eggs, bread, rice, cereals etc). How should we deal with these attributes that have many categories? Should I still follow the same procedure u have described here?
2. If its an ordinal attribute(values like Low, medium, High) can I just change as 1,2 and 3 instead?
Please help me understand?
Hello Shreya,
1. Yes. If the variable has n categories you will need n-1 dummy variables.
2. Yes. If you have ordinal data and you want the order taken into account then you need to use one variable with variables such as 1, 2 and 3 (to capture the order).
Charles
Hi Charles,
If the data/independent variables have both Categorical and quantitative data. Can multiple regression be used?
Yes
Hi Charles,
Regarding the question above. How would you code the dummy variables for independent variables that have both categorical and quantitative data. Would coding the dummy variable, in this instance, be necessary in order to carry out a multiple regression?
Thank you,
Ryan
Ryan,
Are you saying that you have some variables that are quantitative and some that are categorical, or are you saying that you have one or more variables that take both categorical and quantitative values. If the latter then please give me an example of such a variable.
Charles
Hi
Three dummy variables were generated for ‘party’ using the Extract Column – is there any way of avoiding this.
I am not sure I understand your question. Are you asking whether there is a way to perform regression with categorical variables without having to use the Extract Column tool?
Charles
Hello Charles,
In view of the above example, would it be correct to communicate the result stating that on average, salaries increase by $625 for each additional year of age?
Or that men earn on average $13,700 more than women, all other things being equal?
Thanks!
~Fred
Fred,
From the data, we can see that men earn $13,750 more than women. From the regression coefficient, we can see that men are expected to earn $13,677.52 more than women. Similarly, for each additional year of age, we expect that a person will increase his/her income by $625.61.
Charles
Charles
Can you add Party 1 and Party 2 results to the following
men are expected to earn $13,677.52 more than women. Similarly, for each additional year of age, we expect that a person will increase his/her income by $625.61.
Hello Chen,
Sorry, but I don’t understand your question. You can perform regression of the type that you seem to be referring to, but I don’t see what this has to do with categorical coding.
Charles
I understand the concept of what you did. Coding categorical data into values, which enables you to perform a ANOVA; however, I am curious is that is appropriate?
If you are analyzing categorical data shouldn’t a different statistical method be used?
I am not challenging your work, just trying to understand. I have a similar issue, and would like to use this technique. I just want to make sure it is statically valid before I go down the wrong path.
Thanks for you help.
Eli
Eli,
Using categorical independent variables is quite common in multiple regression.
If the dependent variable is categorical then you would usually use logistic regression or some other technique and not multiple regression.
Charles
Thank you.
Thank you for posting these. Your website is very useful!
Hi Charles,
I’m having difficulty understanding how to interpret the p-values for party 1 and party 2. As the p-value for party2 is high, does that mean that only party 1 helps predict the salary? What about party 3 (which is when both party 1 and 2 are equal to zero)? Sorry for being confused.
Adam,
A low p-value (usually p-value < alpha) indicates that the corresponding coefficient is significantly not equal to zero, which in turn means that the corresponding variable is making a contribution to the prediction (of salary in this example). Since Party 3 is not an explicit variable in the regression model, we don't know what sort of contribution it makes. However, we can use a different coding in which Party 3 is one of the explicit variables to see whether it is making a significant contribution. Charles
Charles,
I replaced Party#2 with Party#3 coding (Ind = 1, Other = 0). The regression showed that Party#3 p = 0.113, and Party#1 p = 0.0004, which is different from from Party#1 p = 0.0037 in the regression using the Party#2 variable. Should the reported Party#1 p = average(0.0037, 0.0004)?
Thanks.
Hi Dave,
It appears that you have used a slightly different catagorical coding, one where Ind = 1. You should expect that the regression coefficients will be different, but the analysis should be the same.
In order to answer specific questions, please email me an Excel spreadsheet with your results.
Charles
Great website! As an Industrial Engineer, I see tons of “Statistical” websites many of which giving bad advice. I found your site a couple of years ago and still enjoy checking to see how you would solve a problem. Most of the time, you give a great explanation to what I did. Or, I learn an alternative means. Always interesting to see the results.
Thank you.
Charles
Don’t mind my question Charles , I understand the k – 1 rule now.
Hi Charles,
I noticed that I haven’t dummy coded my independent variables which are categorical. As I am coding them now, you said, the model needs k – 1 dummy variables but I would want to code all of the categories if possible, as in, include a column for the – 1 category that’s not included. Can I instead just use k dummy variables instead of k – 1? or is it the norm to have k -1 variables?
Thank you,
Matt