In Total Least Squares we describe total least squares (TLS) regression where there is one x variable. On this webpage, we briefly describe the multiple regression version.
Basic Overview
Suppose we have a sample of size m for n independent variables and one dependent variable. The key to finding the regression coefficients, in this case, is to use the Singular Value Decomposition (SVD) of the m × n+1 matrix A whose first n columns consist of the X data minus the means of each column and whose last column consists of the Y data minus the mean of the Y data.
The SVD of A takes the form A = UDVT where U, D, and V are matrices with some special properties as described in Singular Value Decomposition. The Real Statistics Resource Pack provides worksheet functions SVD_U, SVD_D, and SVD_V that can be used to calculate U, D, and V in Excel.
In particular, the formula =SVD_V(R1, iter) calculates the n+1 × n+1 V matrix for the range R1 containing A. Here iter is the number of iterations used in the algorithm where iter defaults to 100.
It turns out that the estimated regression coefficient bk for the xk variable can be calculated as
![]()
where V = [vij]. The intercept regression coefficient is then given by
Example
Example 1: Find the regression coefficients using total least squares for Example 1 of Multiple Regression Least Squares (duplicated in Figure 1).
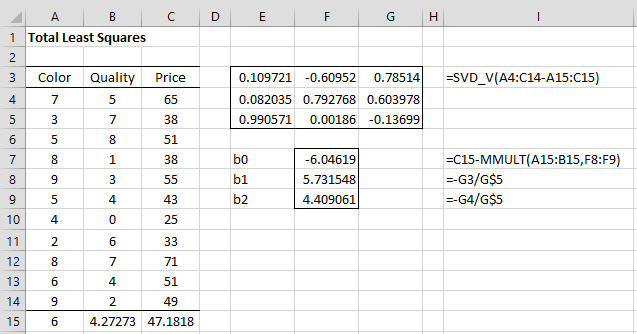
Figure 1 – Regression using TLS
Here, cells A15, B15, and C15 contain the means for the Color, Quality, and Price sample data. The resulting regression equation is Price = 5.731548 * Color + 4.409061 * Quality – 6.04619. The regression equation defined by ordinary least squares is Price = 4.895288 * Color + 3.758415 * Quality + 1.751401.
Worksheet Function
Real Statistics Function: For an array or range R1 containing X values for k independent variables and R2 containing y values, we have the following array function.
TRegCoeff(R1, R2, iter) = k+1 × 1 column array consisting of the regression coefficients based on total linear regression using the data in R1 and R2. iter (default 100) is the number of iterations used to calculate the SVD decomposition.
For Example 1, the output from =TRegCoeff(A4:B14,C4:C18) is the same as shown in range F7:F9 of Figure 1.
Simple TLS Regression
The approach using SVD also works for the simple case where there is only one x variable.
Example 2: Repeat Example 1 from Total Least Squares using the same approach used for Example 1.
The result is shown in Figure 2. Note that we obtain the same results as in Total Least Squares.
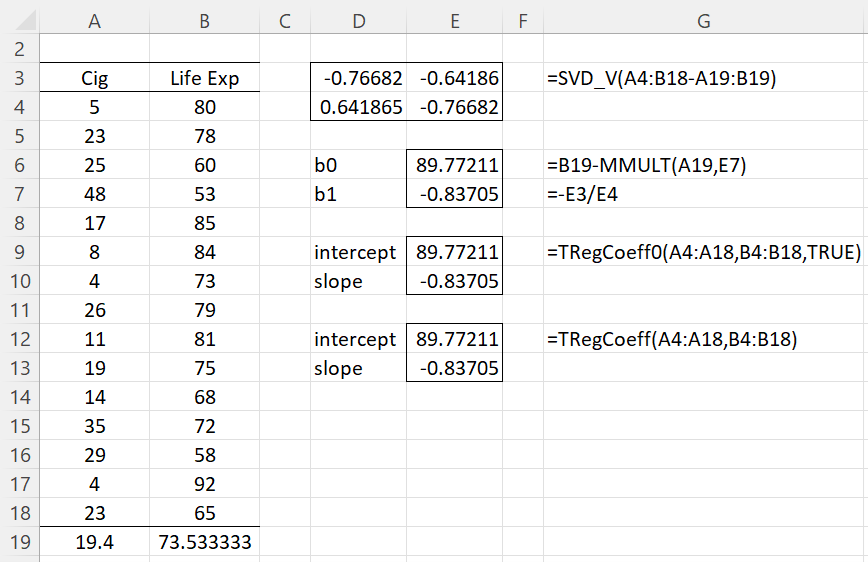
Figure 2 – Simple TLS Regression
Examples Workbook
Click here to download the Excel workbook with the examples described on this webpage.
Reference
Gavin, H. P. (2017) Total least squares. Duke University
http://people.duke.edu/~hpgavin/SystemID/CourseNotes/TotalLeastSquares.pdf
Hi Charles,
Is there a way to get R-squared for a total least squares regression (with 2 predictors) ? And is there a way to get the AICc criterion ?
Many thanks.
Sacha V.
Sacha,
Sorry, but I don’t know how to calculate R-square or AICc for TLS.
Charles
Hey Charles,
could you tell me how i could build a weighted total least squares in excel. its the only thing i havent found on these awesome pages.
and thx so much, for the great help im getting because of your awesome work with this website.
Hello JBK,
I am very pleased that you have been getting value from the Real Statistics website.
I haven’t yet addressed weighted total least squares. Here is an article which you may find useful:
https://www.degruyter.com/view/j/jogs.2012.2.issue-2/v10156-011-0036-5/v10156-011-0036-5.xml
Charles
Which test is used for to check the significance of explanatory variable (I think in lineaner regression model):
Balbir,
I have not indicated any test. I will eventually add this.
Charles