Basic Concepts
In ordinary linear regression, our goal is to find the equation for a straight line y = bx + a which best fits the data (x1, y1), …, (xn, yn). This results in values ŷi = bxi + a. The approach is to select values for a and b which minimize the following

As we can see from Figure 1, this minimizes the sum of the distances squared (i.e. e2) only in the y direction.
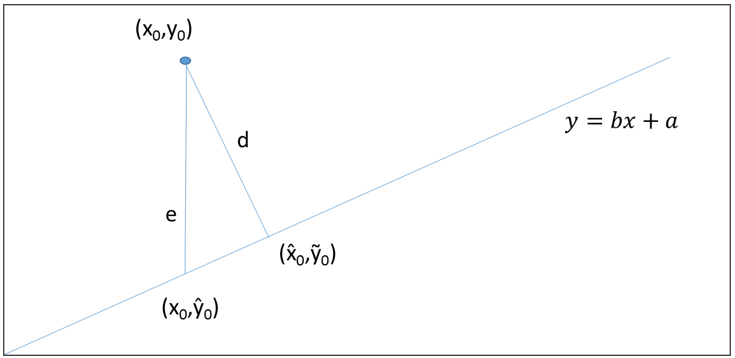
Figure 1 – Distance between a point and a line
The actual distance is shorter, as shown by d in Figure 1. Here (

![]()
In total least squares regression, (aka orthogonal linear regression) we find the values of a and b that minimize the sum of the squared Euclidean distances from the points to the regression line (i.e. the d2). It turns out that this is equivalent to minimizing:

The value of b that minimizes this expression is given by
![]()
where
![]()
![]()
and x̄ and ȳ are the means of the xi and yi values respectively. The intercept can now be expressed as![]()
Example
Example 1: Repeat Example 1 of Least Squares using total least squares regression (the data are replicated in Figure 2).
The calculations are shown in Figure 2.
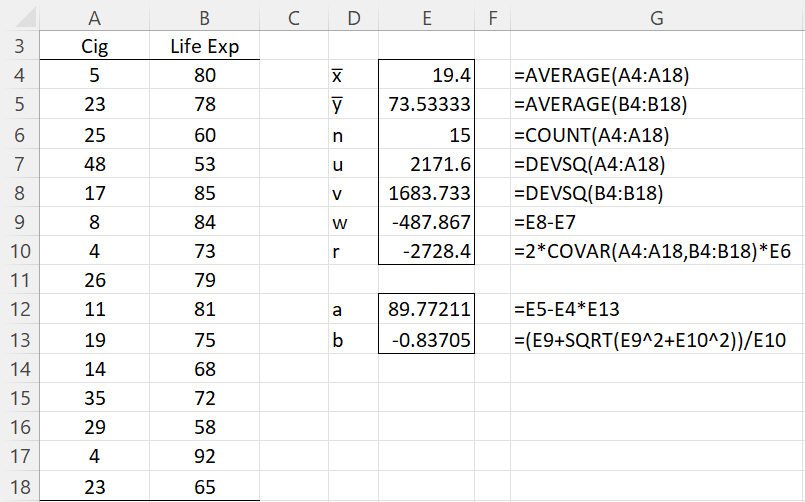
Figure 2 – Total Least Squares Regression
We see that the regression line based on total least squares is y = -0.83705x + 89.77211. This is as compared to the ordinary linear regression line y = -0.6282x + 85.72042.
In Figure 3, we graph the ordinary regression line (in blue) from Example 1 versus the regression line based on total least squares (in red).
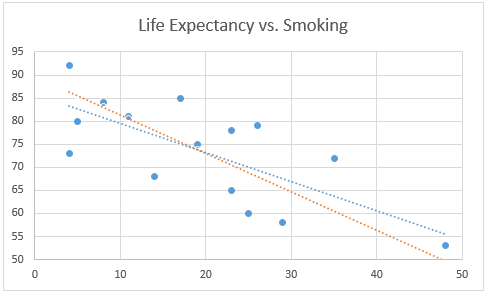
Figure 3 – TLS (red) vs. OLS (blue)
Worksheet Function
Real Statistics Function: For array or range R1 containing x values and R2 containing y values, the Real Statistics Resource Pack supplies the following array function.
TRegCoeff0(R1, R2, lab) = 2 × 1 column array consisting of the intercept and slope coefficients based on total linear regression using the data in R1 and R2.
If lab = TRUE (default FALSE), then an extra column is appended to the output from TRegCoeff0 containing the labels “intercept” and “slope”.
For Example 1, the output from =TRegCoeff0(A4:A18,B4:B18) is the same as shown in range E11:E12 of Figure 2.
Confidence Interval
Click here for how to estimate the standard errors and confidence intervals for the intercept and slope coefficients.
Comparison with a Gold Standard
Click here for how to use TLS regression to compare a new methodology with a gold standard.
Relationship to Deming Regression
Total least squares regression is a special case of Deming regression, where lambda = 1. For Deming regression, we show how to calculate the standard errors using the Jackknife procedure, and so we can also obtain results similar to those shown in TLS Regression Confidence Intervals using the DRegCoeff function and the Deming Regression data analysis tool by setting Lambda = 1
Multivariable TLS Regression
Click here for how to extend TLS regression to the case where there are multiple independent variables.
Examples Workbook
Click here to download the Excel workbook with the examples described on this webpage.
References
Elcio Cruz de Oliveira and Paula Fernandes de Aguiar (2013) Least squares regression with errors in both variables: case studies
https://www.researchgate.net/publication/262474173_Least_squares_regression_with_errors_in_both_variables_Case_studies
Tellinghuisen, J. (2020) Least squares methods for treating problems with uncertainty in x and y. Anal. Chem. 2020, 92, 16, 10863–10871
https://pubmed.ncbi.nlm.nih.gov/32678579/
Mandel, J. (2018) Fitting straight lines when both variables are subject to error
https://www.tandfonline.com/doi/abs/10.1080/00224065.1984.11978881
Thank you for sharing details regarding total least squares method.
Is it possible to show how to calculate the confidence interval of the slope and intercept for a simple X-Y data set?
Using this to compare two gages and want to know if the intercept (i.e bias) and slope are significantly different.
thanks again.
Hello Ajoy,
I just added new information to the website that explains how to calculate confidence intervals for the slope and intercept.
Since total least squares is a special case of Deming regression, where lambda = 1, you can also use the approach described in that part of the website.
Charles
Hello Charles,
Very useful.
Thank you,
José Antonio
Hi Charles,
Thank you.
How do I implement this formula in excel when I have two predictors instead of one?
Best
Gianluca
See Total Least squares Regression
Charles
Hi Charles,
Very useful – as usual.
I am trying to perform this orthogonal regression in excel using more than 1 predictor. How should I adapt my formula?
Thank you,
Gianluca
Hi Gianluca,
See https://real-statistics.com/multiple-regression/total-least-squares-regression/
Charles
Could you please give me a source reference for the cigarette fatality data?
Thank you.
This is made-up data and is not based on a real study. Almost all the data on this site has been selected to make it easy to explain the statistical concepts.
Charles
Hi Charles,
Thanks for the great post. Just one question in regards to the Orthogonal Regression, I have a specific data set which would generate odd outputs (Toolpak from Real Statistics generates a slope of 1833 and intercept of -122272.69, meanwhile the OLS generates a slope of 0.223, intercept of 2718.45, I also used Python’s ODR which generates a slope of -21.09 and an intercept of 4207).
I am not sure what could generate such a huge discrepancy… May I send you the Excel Sheets directly to your email?
Thanks for your help.
Paul,
Yes, please send this to my email.
Charles
Hi Charles,
Already sent you the file. Please let me know how you think.
Thx
Paul,
I have not yet received the file.
Charles
Charles,
I just sent the email again to both of your email addresses.
Let me know if you receive the file…
Thanks
Paul,
I have now received your email. Thanks.
Charles
Hi Charles,
Just a quick follow up on the topic. Have you figured out the reason why different methods deviate?
My thought is because of the distance for these data points to the fitted line. But not sure if my guess is correct.
Thanks for your help.
Paul
Great post !!!
How to find out points that are outliers ? How to decide a threshold for eliminating those? Thank you.
Hi Charles,
Thank you for the great post!
I tried the method with your example data, and I got the same result. Then I started plugging in my own data and it’s doing something weird.
x->1,2,3,4,5,6,7,8,9,10
y->0.98, 0.75, 0.78, 0.85, 0.89, 1.13, 1.26, 1.57, 1.94, 1.61
While the ordinary regression would give me slope = 0.12 and intercept = 0.53, the Total Least Squares gives me slope = -8.46 and intercept = 47.71
I don’t understand why it’s like this. Can you please help me? Thanks a lot!
Alex,
The slope and intercept values do seem very different from the values from ordinary regression.
I see that if in calculating the slope I use the formula n = w + sign(u-v) * sqrt(w^2 + 1), i.e. I use sign(u-v) instead of sign(v-u), then I get a slope of .1182 and intercept of .5259, which are pretty close to the ordinary regression values. I will check this out.
In the meantime, thanks very much for bringing this issue to my attention.
Charles
Thanks for your reply, Charles. I will play with it. Let me know if you figure this out. Thanks again.
Alex,
I have corrected the error on the webpage. The new version of the formula for the slope is equivalent to the previous version except that the sign problem before the square root term is now fixed.The TRegCoeff0 function still has the error. I will fix this shortly. In the meantime you can use the TRegCoeff function.
Thanks again for your help.
Charles
Thanks Charles! I appreciate your help!!
In this calculation, when I interchange the sample of values, then the betta becomes -1,19467 and does not equal the previous value of -0.83705.
What is missing is the TLS method.
The previous calculation where the sign is used leaves the same betta value.
Roman,
If you send me an Excel file with your data and analysi, I will try to figure out what is going on.
Charles
Charles, thank you for your statistics lessons. Comprehensive, well rooted in simple demonstration how to do it in Excel. Excellent, this is among the best content I find online. Excellent work, very valuable and very much appreciated!
Otto,
Thank you very much.
Charles
Thanks for this solution in Excel. I have a question: when I implement your solution I get the answer you provided where the slope for Lif Exp as a function of Cig is -0.83705. I would expect then that the slope for the Cig as a function of Life Exp would be the inverse or -1.19467, and that is verified as correct by using the PCA method.
But when I reverse the inputs and copy the Life Exp numbers to the A column and Cig to the B column I get a slope of 0.83705. This does not seem correct, do you know if I am doing something wrong? Why does switching the dependent and independent variables not have the expected effect? Thanks.
Ryan,
I suggest that you perform the following experiment. Calculate the sum of the distances squared from each of the sample data points to the line y = -.83705x + 89.7721 as shown on the referenced webpage. Then do the same with the line y = -1.19467x + a (where a is the intercept that you believe is correct). If the sum calculated from this second line is smaller than that from the first line, then clearly I have made an error.
Charles
That works fine. My question is how come switching the X and Y inputs does not change the output? Are you able to get a result of -1.19467 for the beta when the inputs are switched, I cannot.
How did you manage to plot figure 3?
Did you make use of the Real Statistics Resource Pack that is available on your website?
Regards
Jaco,
No, I didn’t need to use the Real Statistics Resource Pack to create the plot, but I did use it to find the Total Least Squares regression coefficients.
The plot is simply two scatter plots superimposed, including linear trendlines. The first scatter plot is for the data in columns A and B, while the second is for the data in columns Q and R.
Charles
How to evaluate the goodness of the fit using Total Least Square Method? Is it in the same way with that of OLS, like R^2.
You can analyze residuals just as you do for OLS. You can also calculate R^2, using the sum of the squared Euclidean distances.
Charles
Can you please elaborate on R^2 for orthogonal regression? Is the formula exactly the same as that for OLS?
Hello Anusha,
You can calculate the R^2 metric in the same way as for OLS, but it doesn’t serve the same purpose. This issue is addressed at
https://www.mathworks.com/matlabcentral/fileexchange/31109-total-least-squares-method
Charles