Introduction
The goal of regression analysis is to describe the relationship between two variables based on observed data and to predict the value of the dependent variable based on the value of the independent variable. Even though we can make such predictions, this doesn’t imply that we can claim any causal relationship between the independent and dependent variables.
Basic Concepts
Definition 1: If y is a dependent variable and x is an independent variable, then the linear regression model provides a prediction of y from x of the form
![]()
where α + βx is the deterministic portion of the model and ε is the random error. We further assume that for any given value of x the random error ε is normally and independently distributed with mean zero.
Observation: In practice, we will build the linear regression model from the sample data using the least-squares method. Thus we seek coefficients a and b such that
![]()
For the data in our sample we will have
![]()
where ŷi is the y value predicted by the model at xi. Thus the error term for the model is given by
![]()
Prediction Example
Example 1: For each x value in the sample data from Example 1 of One Sample Hypothesis Testing for Correlation, find the predicted value ŷ corresponding to x, i.e. the value of y on the regression line corresponding to x. Also find the predicted life expectancy of men who smoke 4, 24 and 44 cigarettes based on the regression model.

Figure 1 – Obtaining predicted values for data in Example 1
The predicted values can be obtained using the fact that for any i, the point (xi, ŷi) lies on the regression line and so ŷi = a + bxi. E.g. cell K5 in Figure 1 contains the formula =I5*E4+E5, where I5 contains the first x value 5, E4 contains the slope b and E5 contains the y-intercept (referring to the worksheet in Figure 1 of Method of Least Squares). Alternatively, this value can be obtained by using the formula =FORECAST(I5,J5:J19, I5:I19). In fact, the predicted y values can be obtained, as a single unit, by using the array formula TREND. This is done by highlighting the range K5:K19 and entering the array formula =TREND(J5:J19, I5:I19) followed by pressing Ctrl-Shft-Enter.
The predicted values for x = 4, 24 and 44 can be obtained in a similar manner using any of the three methods defined above. The second form of the TREND formula can be used. E.g. to obtain the predicted values of 4, 24 and 44 (stored in N19:N21), highlight range O19:O21, enter the array formula =TREND(J5:J19,I5:I19,N19:N21) and then press Ctrl-Shft-Enter. Note that these approaches yield predicted values even for values of x that are not in the sample (such as 24 and 44). The predicted life expectancy for men who smoke 4, 24 and 44 cigarettes is 83.2, 70.6 and 58.1 years respectively.
Variance Breakdown
Definition 2: We use the following terminology:
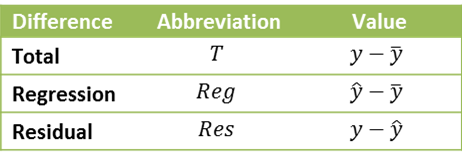
The Residual is the error term of Definition 1. We also define the degrees of freedom dfT, dfReg, dfRes, the sum of squares SST, SSReg, SSRes and the mean squares MST, MSReg, MSRes as follows:

![]()
![]()
![]()
Observation: SST is the total variability of y (e.g. the variability of life expectancy in Example 1 of One Sample Hypothesis Testing for Correlation). SSReg represents the variability of y that can be explained by the regression model (i.e. the variability in life expectancy that can be explained by the number of cigarettes smoked), and so by Property 1, SSRes expresses the variability of y that can’t be explained by the regression model.
Thus SSReg/SST represents the percentage of the variability of y that can be explained by the regression model. It turns out that this is equal to the coefficient of determination.
Observation: Note that for a sample size of 100, a correlation coefficient as low as .197 will result in the null hypothesis that the population correlation coefficient is 0 being rejected (per Theorem 1 of One Sample Hypothesis Testing for Correlation). But when the correlation coefficient r = .197, then r2 = .039, which means that model variance SSReg is less than 4% of the total variance SST which is quite a small association indeed. Whereas this effect is “significant”, it certainly isn’t very “large”.
Observation: From Property 2, we see that the coefficient of determination r2 is a measure of the accuracy of the predication of the linear regression model. r2 has a value between 0 and 1, with 1 indicating a perfect fit between the linear regression model and the data.
Standard error of the estimate
Definition 3: The standard error of the estimate is defined as
![]()
Observation: The second assertion in Property 4 can be restated as

For large samples 
![]()
Note that if r = .5, then
![]()
which indicates that the standard error of the estimate is still 86.6% of the standard error that doesn’t factor in any information about x; i.e. having information about x only reduces the error by 13.4%. Even if r = .9, then sy.x = .436·sy, which indicates that information about x reduces the standard error (with no information about x) by only a little over 50%.
Summary Property
a) The sums of the y values is equal to the sum of the ŷ values; i.e. 

b) The mean of the y values and ŷ values are equal; i.e. ȳ = the mean of the ŷi
c) The sums of the error terms is 0; i.e. 
d) The correlation coefficient of x with ŷ is sign(b); i.e. rxŷ = sign(rxy)
e) The correlation coefficient of y with ŷ is the absolute value of the correlation coefficient of x with y; i.e. 

f) The coefficient of determination of y with ŷ is the same as the correlation coefficient of x with y; i.e. 

Proofs
Click here for the proofs of the various properties described above.
Examples Workbook
Click here to download the Excel workbook with the examples described on this webpage.
Reference
Howell, D. C. (2010) Statistical methods for psychology (7th ed.). Wadsworth, Cengage Learning.
https://labs.la.utexas.edu/gilden/files/2016/05/Statistics-Text.pdf
Hello Sir,
By mistake I have posted in “https://real-statistics.com/regression/”
I have the data, which is as below:
x = [1, 2, 3, 4, 5]
y1 = [26.5, 139, 269, 337, 409]
y2 = [26.2, 138, 273, 343, 404]
Using the raw data, I want to have Results of Regression Analysis as per https://ibb.co/r7WFrzm.
Thanks for the help.
Sorry, but I am not sure what First, SEcond and Third order refer to.
Perhaps this is some sort of polynomial regression where the order refers to the degree of the polynomial. See
https://real-statistics.com/multiple-regression/polynomial-regression/
Charles
Hello Charles can the independent variable be a date or year?
Hi Claudine,
Yes, it can be a date or year. If a date, it should be coded as a numeric value.
Charles
Hi Charles,
We have only month-wise ordered Qty. Could you help me how will predict about next month upcoming ordered Qty?
Hi Gxan,
There are a number of approaches for performing regression based on time series data. You are likely to need to pay attention to autocorrelation and perhaps to seasonality. E.g. see the following
https://www.real-statistics.com/time-series-analysis/
https://www.real-statistics.com/multiple-regression/multiple-regression-analysis/seasonal-regression-forecasts/
https://www.real-statistics.com/multiple-regression/autocorrelation/
Charles
Dear Charles
I face a practical issue that the fitted Simple linear regression is significant , but slope is not significant. R squared is 70% . Do I accept this model? Please assists me
Hello Nidhi,
Are you saying that you only have one independent variable and the slope for the corresponding coefficient is not significant?
What measure are you using to determine that the fitted regression is significant?
Charles
Dear Charles
Yes, it has only an independent variable and the slope for the corresponding coefficient is not significant.
Measures considered to determine that the fitted regression is significant:
1-the statistical significance of the overall model
2-the percentage (or proportion) of variance explained
3-the precision of the predictions from the regression model.
All three measures suggested the model is a good fit, but the coefficient of the independent variable (slope) is not significant. I think it may be a reason for the small sample size ( sample size 30). Waiting for your guidance.
Thanks
Nidhi
Hello Nidhi,
Please email me your data and regression results, and I will try to answer your question.
Charles
Dear Sir
Population size is 15 . Firm collect all 15 staff data. Normally we fit regression model for sample data. Sorry I am not good in this , so please clarify shall we fit the regression for census data ( it means all the population information is available, in this case population size is 15)
Kind regards
V.Valavan
Dear Sir
Thank you so much for your quick turnaround. Well received your points. I need one more clarification. A small firm has only 15 sales representatives. The firm is interested to identify the relationship between the yearly sales of the representatives (Y) with working experience of the representatives (X1), geographical location of the representatives (X2), Gender of the representatives (X3), and a number of accounts handled by representatives (x4). All the information was collected from this 15 representatives-so we have population data. In this case, how we will fit the model ( regression is not appropriate in this case). Any other suggested method to fit the model? Please advise me
I don’t completely understand. Why is regression not appropriate in this case?
Charles
It seems like regression could be used. Why do you think that regression is not appropriate?
Charles
Dear Sir
The population size is 15. The firm collects all 15 staff data. Normally we fit a regression model for sample data. Sorry I am not good at this, so please clarify shall we fit the regression for census data ( it means all the population information is available, in this case, the population size is 15)
Kind regards
V.Valavan
Dear Sir
Because we calculate slope coefficient Beta for population ( as the total population size is 15 and we collect all of this 15 information). we could not calculate the Beta hat because it is population data, not the sample data. Therefore the standard error for Beta does not make much sense.
When we calculate test statistics for the beta hat, we divide the beta hat value by its standard error. In this case, we calculate Beta (for population), so the standard error of Beta does not make sense.
Kind regards
V.Valavan
When you fit a regression line to any data (sample or population), there is an error unless all the data fits exactly on the line, and so standard error makes sense.
Charles
Yes, you can perform regression on population data.
Charles
Thank you so much sir
Dear sir, I read a regression analysis report conducted by an institute. They fit a regression model to identify the relationship between staff satisfaction ( y variable) and their years of experience in that firm , leadership style , gender etc. but for this study they interview all their staff working in various branches ( it means they had fitted model for the population data, not for sample data ). Does it make sense ? ( if we fit regression model directly for population data , then what is the use of p-values ?, Regression is an inferential statistics). When your time permits , please throw some Light on it
Hello Valavan,
If you have complete population data, why perform regression at all? It could be that you will use this population data as if it were sample data and use the regression results to gain information about other populations.
In any case, the p-values give information about which independent variables contribute significantly to the regression results. These values are only worthwhile when the regression itself is worthwhile.
Charles
Dear Sir
Hope you are doing well. Please clarify the following:
Shall we for regression model for census data ( I have data for who population) to identify the relationship between two variable ? Does it make sense? If so in this case we do not bother about the p- value of coefficient component. For example we do not bother about the significant value of beta1. Please throw some light on it
Kind regards
V.Valavan
Sorry, but I don’t understand your comment.
Charles
Running ‘Regcoeff’ function with missing values briught out error.
is it possible to run ‘Regcoeff’ except missing values?
See https://real-statistics.com/handling-missing-data/
Charles
Is it necessary to check normality of y and x values before doing regression analysis/scatter plot and transform the data if not normal?
See the response to your other comment regarding normality. You do scatter plots to determine whether the (x,y) points appear to be aligned along a line.
Charles
Hello Charles,
If every point in curve repeated more than one time. eg. 5 point calibration and each point repeated twice . How to calculate n and df
Sorry, but I don-t understand your question.
Charles
When setup calibration curve x,y. If each x (concentration) analyzed two times as repeatability (y1,y2). So have 5 x levels and 10 y(area) or analysis . How to calculate n will be 5 or 10
x y
1 1.1
1 1.2
2 2.2
2 2
5 4.9
5 5
7 7.2
7 7.3
10 10.3
10 9.9
n = 10. The sample is not a random sample though.
Charles
do u have any example on how report the analysis?
Hi Charles!
Nice add-in. I am reviewing statistical software and found this very useful. Independent learners cannot afford costly packages. Thank you!
In the paragraph above Definition 2 on this page, I think you should have TREND(J5:J19,I5:I19, N19:N21) instead of TREND(N19:N21,J5:J19,I5:I19). I have not used array formulas before and so I did the exercise to get a hands-on experience.
Hi Naga,
I am very pleased that you find the software useful. Thank you very much for finding the mistake in the formula. I have now corrected the error.
On behalf of all the people who use it, I appreciate your help in improving the website.
Charles
Hi Charles,
I would appreciate some guidance- I am helping with a study designed to evaluate whether a preoperative score on a certain scale (continuous scores from 1-100) can predict postoperative outcomes (also scored on continuous scales from 1-100). This seems like a fairly straightforward regression situation to me, but using the realstats pack I seem to be running into issues since I have 1 independent variable (pre-op score) and multiple dependent variables (post-op scores). Can you suggest an analysis strategy?
Thanks!
Amanda,
You can multiple regressions, one for each dependent variable. This should be sufficient if there is little correlation between the dependent variables.
Alternatively, you can use multivariate multiple linear regression. The initial output is identical to that from separate multiple regressions, but additional analyses are performed. The Real Statistics Resource Pack doesn’t support this second step yet.
Charles
Thank you!
Hi Charles,
Is there a way to determine order of regression analysis (if data requires first order regression or second order in other words linear regression or polynomial regression) using realstats?
I have multiple variables and xl does not have a correct way to judge if data requires either linear regression or polynomial regression other than looking at p-value, which in my case 0.05.
Yask,
I don’t know of a simple way to determine the optimum order of polynomial regression model. I will look into this for a future enhancement.
To make matters worse you could have interactions: y = x^3 + z^3 + x^2 + x^3*z^2 + xz + x + z (with two independent variables x and z).
Charles
Hi Charles,
I am running a regression test involving life expectancy as the dependent variable and am examining the independent variables: income, pharamacuetical spending… as variables affecting life exp. Now how do I run the regression, do I also compile data on life expectancy and put that as the dependent variable in Stata?
Amy
Amy,
Sorry, but I don’t use Stata and so can’t answer your question. You can run the regression data analysis from Excel or from the Real Statistics Resource Pack.
Charles
Hi Amy,
have you tried SPSS Statistic? Its a software available online. You can use it to run your data. you can also check youtube on how to handle SPSS statistic.
Hello Mr. Charles,
I have figures only for independent variable. So how can I take dependent variable values in order to conduct correlation and regression test.
You can’t. You need a dependent variable to perform regression. Perhaps one of the independent variables is really a dependent variable.
Charles
Dear Charles,
I have a sample of 30 to measure the factors constraining to the adoption of technology. I am thinking to run regression analysis to adoption rate ( if it is more that 50% considered as 1 and less than 50 is 0 taking 50 percent adoption as threshold limit).
to measure the constraining factors , I used the 5 point likert scale. (highly significant to least significant) and already extracted important variables using principal component analysis.
Now what kind of regression analysis should I use to measure the relative importance of each factors ?. Linear or multiple ?
Nadee
Dear Nadee,
When you say “multiple” I assume that you mean “multiple linear regression”, which just means that you have more than one independent variable. When you have only one independent variable often the term “linear regression” or “simple linear regression” is used. Since you say that you have multiple factors, you would often use multiple linear regression.
Since your outcome (dependent variable) could be viewed as dichotomous (0 or 1), you might find that logistic regression gives a better fit for the data. You can compare AIC values for this.
Charles
hi Charles,
I had a set of data to do the regression, but the result I have got from this addin is different to EXCEL. Could you pls let me know why is it?
Thanks.
Hi Dennis,
Can you send me the data you used so that I can find out what went wrong? My email address is czaiontz@gmail.com.
Charles