We now show how to test the value of the slope of the regression line.
Basic Approach
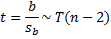
By Property 1 of One Sample Hypothesis Testing for Correlation, under certain conditions, the test statistic t has the property
![]()
But by Property 1 of Method of Least Squares
![]()
and by Definition 3 of Regression Analysis and Property 4 of Regression Analysis
![]()
Putting these elements together we get that
![]()
where
![]()
Since by the population version of Property 1 of Method of Least Squares
![]() it follows that ρ = 0 if and only if β = 0. Thus Theorem 1 of One Sample Hypothesis Testing for Correlation can be transformed into the following test of the hypothesis H0: β = 0 (i.e. the slope of the population regression line is zero):
it follows that ρ = 0 if and only if β = 0. Thus Theorem 1 of One Sample Hypothesis Testing for Correlation can be transformed into the following test of the hypothesis H0: β = 0 (i.e. the slope of the population regression line is zero):
 Example
Example 1: Test whether the slope of the regression line in Example 1 of Method of Least Squares is zero.
Figure 1 shows the worksheet for testing the null hypothesis that the slope of the regression line is 0.

Figure 1 – t-test of the slope of the regression line
Since p-value = .0028 < .05 = α (or |t| = 3.67 > 2.16 = tcrit) we reject the null hypothesis, and so we can’t conclude that the population slope is zero.
Note that the 95% confidence interval for the population slope is
b ± tcrit · sb = -628 ± 2.16(.171) = (-.998, -.259)
Testing equality of slopes
We can also test whether the slopes of the regression lines arising from two independent populations are significantly different. This would be useful for example when testing whether the slope of the regression line for the population of men in Example 1 is significantly different from that of women.
Click here for additional information and an example about Hypothesis Testing for Comparing the Slopes of Two Independent Samples.
Worksheet Functions
Excel Functions: where R1 = the array of observed values and R2 = the array of observed values.
STEYX(R1, R2) = standard error of the estimate sy∙x = SQRT(MSRes)
LINEST(R1, R2, TRUE, TRUE) – an array function that generates a number of useful statistics.
To use LINEST, begin by highlighting a blank 5 × 2 range, enter =LINEST( and then highlight the R1 array, enter a comma, highlight the R2 array and finally enter ,TRUE,TRUE) and press Ctrl-Shft-Enter.
The LINEST function returns a number of values, but unfortunately no labels for these values. To make all of this clearer, Figure 2 displays the output from LINEST(A4:A18, B4:B18, TRUE, TRUE) using the data in Figure 1. I have added the appropriate labels manually for clarity.
 for data in Figure 1")
Figure 2 – LINEST(B4:B18,A4:A18,TRUE,TRUE) output
R Square is the correlation of determination r2 (see Definition 2 of Basic Concepts of Correlation), while all the other values are as described above with the exception of the standard error of the y-intercept, which will be explained shortly.
Data analysis tool
Excel also provides a Regression data analysis tool. The creation of a regression line and hypothesis testing of the type described in this section can be carried out using this tool. Figure 3 displays the principal output of this tool for the data in Example 1.

Figure 3 – Output from Regression data analysis tool
The following is a description of the fields in this report:
Summary Output
- Multiple R – correlation coefficient (see Definition 1 of Multiple Correlation, although since there is only one independent variable this is equivalent to Definition 2 of Basic Concepts of Correlation)
- R Square – coefficient of determination (see Definition 1 of Multiple Correlation), i.e. the square of Multiple R
- Adjusted R Square – see Definition 2 of Multiple Correlation
- Standard Error = SQRT(MSRes), can also be calculated using Excel’s STEYX function
- Observations – sample size
ANOVA
- The first row lists the values for dfReg, SSReg, MSReg, F = MSReg/MSRes and p-value
- The second row lists the values for dfRes, SSRes and MSRes
- The third row lists the values for dfT and SST
Coefficients (third table)
The third table gives key statistics for testing the y-intercept (Intercept in the table) and slope (Cig in the table). We will explain the intercept statistics in Confidence and Prediction Intervals for Forecasted Values. The slope statistics are as follows:
- Coefficients – value for the slope of the regression line
- Standard Error – standard error of the slope, sb = sy∙x / (ssx * SQRT(n-1))
- t-Stat = b/sb
- P-value = T.DIST.2T(t, dfRes); i.e. 2-tailed value; =TDIST(t, dfRes, 2) in Excel 2007
- 95% confidence interval = b ± tcrit ∙ sb
Residuals
In addition to the principal results described in Figure 3, one can optionally generate a table of residuals and a table of percentiles as described in Figure 4.

Figure 4 – Additional output from Regression data analysis tool
Residual Output:
- Predicted Life Exp = Cig * b + a; i.e. ŷ
- Residuals = Observed Life Exp – Predicted Life Exp; i.e. y – ŷ
- Standard Residuals = Residual / Std Dev of the Residuals (since the mean of the residuals is expected to be 0): i.e. e/se
For example. for Observation 1 we have
- Predicted Life Exp = -.63 * 5 + 85.72 = 82.58
- Residuals = 80 – 82.58 = -2.58
- Standard Residuals = -2.58 / 7.69 = -.336
Note that the mean of the residuals is approximately 0 (which is consistent with a key assumption of the regression model) and a standard deviation of 7.69.
There is also the option to produce certain charts, which we review when discussing Example 2 of Multiple Regression Analysis.
Examples Workbook
Click here to download the Excel workbook with the examples described on this webpage.
References
Compute Expert (2022) How to use LINEST formula in Excel
https://computeexpert.com/english-blog/excel-formulas-list/linest-formula-in-excel
Charles,
I would like to know when a sequence of measurements has reached a steady state (zero slope with a known probability) to avoid running an experiment longer than necessary. If I use the last three points (sequence # for x and measurement for y) and find the slope is not significantly different than zero (p > 0.05), I can say the probability of zero slope is > 5%, which seems too weak. Is there a standard method to estimate when steady-state is reached? Maybe I should continue the run until the slope p > 0.50? Thanks.
Dave,
See my email responses.
Charles
Hello Charles,
Is the least squares method valid when the x values are categorical. My x data are chonologically ordered ID codes, and my y data are measurements. I wish to test whether a linear through my data points has a non-zero gradient, i.e. whether the y-values show a tendency to increase, decrease or stay constant over time.
Thank you
Hello Chris,
The least-squares method is commonly used to find the linear regression model coefficients even when some of the x data is categorical. The data for the categorical variables are coded using dummy variables as explained at
Dummy variables
You can then perform the typical analyses to test the coefficients (including for the dummy variables) such as significantly different from zero, positive, negative.
As far as testing for a trend, this depends on what you mean by trend.
Charles
Charles, really outstanding and excellent work.
I have a situation where I need to calculate the coefficient of determination and standard error, where the constant is 0. I can use LINEST, but I ultimately need to code this in another software package (AmiBroker) that does not have LINEST function.
What would be a more organic way of calculating these without using Excels LINEST function?
Any help is greatly appreciated!
Eric,
How these values are calculated by hand is described at https://www.real-statistics.com/multiple-regression/multiple-regression-analysis/multiple-regression-analysis-excel/
Charles
I am not able to find out how you got the t stat and the P value for the intercept. Any help?
John,
There are many ways of obtaining the t-stat and p-value for the intercept. For the example presented on this webpage, we used Excel’s Regression data analysis tool, as shown in Figure 3. t-statistic = the intercept coefficient divided by the standard error for this coefficient. The p-value is calculated by T.DIST.2T(t,df).
Charles
Dear Dr. Zaiontz,
Sorry, this might seem trivial, but i don’t think this relationship is coming from the Property 4 of Regression Analysis – maybe more from Property 1 of Method of Least squares.
rho = beta * sigma (x) / sigma (y)
But again, I might be very wrong.
Thank you,
Cristian
Cristian,
Yes, you are correct. I have now corrected this on the webpage.
Thanks very much for your help.
Charles
Hi Charles,
I’m trying to use this method but my data set is dates and percentages. Is excel “smart” enough to understand dates while doing t-tests? When I have it plugged in right now, excel is totaling up the dates as numbers. Help!
Thanks,
Haley
Haley,
The t-test only works on numbers, not dates. Fortunately, Excel stores dates as numbers and so the t-test may be valid (depending on what hypothesis you are trying to test).
Charles
what if I have more than one factor with p-values greater than my threshold? Do I reject all at once or one-by-one? If one-by-one which one I should reject first, the factor with the greatest p-value or the one with smallest?
There are many ways to handle this. One such approach is described at
Stepwise RegressionStepwise Regression
Charles
Hello Charles,
I have a set of data whose trend line is negative but the data itself isn’t touching any of the line. So, I wanted to conduct a t-test of whether the regression is negative. However, when I follow the steps of your example from Figure 1, I reach the conclusion that I fail to reject the null. This doesn’t make sense since there’s a clear visual observation from the graph that the slope is not in fact zero. How could I conclude my lab report with this kind of result? Do you think I should just not include this statistical test in it (if it’s making my data look weak or something)?
Thank you!
Hello Marilyn,
I would need to see the data and regression model in order to address your questions.
If you email me an Excel file with your data and regression results, I will try to answer your questions.
Charles
How can slope affect the regression line. Example for if a good slope is from -3.3 to -3.6 on a regression line, if I use a slope of say -4.0 how will that affect my regression line.
Hello Alejandro,
If a good slope is say -3.45 (with a 95% confidence interval of -3.6 to -3.3), then using a slope of -4.0 will mean that the predictions from this model will be worse than those from the model with the good slope estimate.
For example, y = -3.45x + a is the prediction for a given x from the good model (here a is the intercept) and y = -4x + a is the prediction from the second model. If say a = 2 and x = 10, the prediction from the good model is y = -32.5 while the prediction from the other model is -38. This is a loss of (-32.5+38)/32.5 = 17% accuracy.
Charles
Describe the steps required to perform a test of the individual significance of a slope
coefficient? What are the null and alternative hypotheses for this test? What is the
rejection rule? Explain. Can someone help me answer this. Thankyou very much
Hello celine,
The answers are on this webpage. What concepts are you having trouble with?
Charles
Hello. Can I ask, How to test if the slope of the regression line is nonzero?
Rhiane,
How to do this is described on this webpage. What part of the test is not clear?
Charles
How do we know that a slope of a regression equation is significant?
Hello Dwight,
When the p-value for the test described on this webpage is less than alpha. Alpha is usually set to .05.
Charles
Hi, Can you tell me why testing the intercept of the regression analysis are sometimes not taken seriously? Why don’t we generally test the hypothesis for the intercept and reject/ fail to reject the null hypothesis that the intercept is zero? Although, excel gives the way to conduct the test in the same way as that of the slope.
Hello Soumitra,
Generally, the slope is the parameter that is of interest, but when it is useful, the intercept can be tested as well. The Real Statistics website shows how to conduct this test.
Charles
Thanks for this Charles, it is extremely useful. Do you have a reference to a paper or book I can use for citations? Warm regards, Simon Woodward.
By the way, you might be interested in this note, that includes testing of intercept and correlation.
http://core.ecu.edu/psyc/wuenschk/docs30/CompareCorrCoeff.pdf
Simon,
Are you looking for a citation to this particular topic or to my website? A reference to this particular topic is Howell’s textbook (see Bibliography). A citation to this website can be found at Citation.
Thanks for the reference to Wuenschk’s paper; I have read it before and have included its topics in the website.
Charles
Hi there,
Should I use regression analysis for testing the significance of changing NO2 concentrations over time? My independent variable is mean monthly data (Jan-10, Feb-10 etc.) and my dependent variable is NO2 concentration.
Sam,
You haven’t provided enough information for me to be able to answer your question.
Charles
Charles,
I have collected NO2 concentrations from a period of 10 years from one site. I wish to see if there are any significant changes in NO2 concentrations over time as the values fluctuate. What other information do you need?
Sam,
If by a significant change, you mean that the slope of the regression line is not zero, then you could use a regression model and see whether the slope parameter is significantly different from zero. See, for example
https://real-statistics.com/regression/hypothesis-testing-significance-regression-line-slope/
Charles
ehab kawal
How would I use sum of squares to test if the slope coefficient B1=-1 or not?
Ive seen so many examples to test if its significantly different from zero or not, but I dont really know where to start!
Jamie,
It looks like you want to test whether b = -1 in the regression equation y = bx + a (where y is the predicted value based on the regression). By algebra, y + x = (b+1)x + a. Let y’ = y + x and b’ = b + 1. Thus, the original equation is equivalent to y’ = b’x + a. But note that b = -1 is equivalent to b’ = 0. Thus, a test for zero slope in y’ = b’x + a is a way to test for slope b = -1.
Charles
Shoudn’t the formula in G9 have “(E3-2)” instead of “(E3-1)”?
Greg,
No. The formula is correct. The df is n – 2, but this part of the formula is n – 1.
Charles
Hello,
Is there a direct equation or formula for sample size estimation in linear regression model containing alpha and beta for the slope?
Reza,
See the following webpage regarding the sample size required. It does not depend on the alpha and beta parameters.
Power for Regression
Charles
I was wondering how to test whether the slope is equal to one?
Thanks
TS,
Here is one approach. Consider the linear equation y = bx + a. First note that the linear equation y = (b-1)x + a has slope of zero if and only if b = 1. Next note that y = (b-1)x + a is equivalent to y’ = bx + a where y’ is y+x. Thus you need to perform the usual test for slope = zero using the original x data, but with the y data replaced by the original y data plus the corresponding original x values. Thus if your original x data were 4, 6, 9, 14 and your original y data were 14, 25, 36, 55, you perform the test for zero slope using x data 4, 6, 9, 14 and y data 18, 31, 45, 69.
Charles
Why are the x values added to the original y instead of subtracted? Isn’t the objective to get, if the original were a line with slope 1, a line with slope zero? Then, if the comparison works for slope zero, you know the original had slope 1?
Or am I totally confused?
Thanks.
I just followed your reply to Sherry from October. Thank you!
Sam,
y = (b-1)x + a is algebraically equivalent to y+x = bx + a, which is y’ = bx +a if y’ = y + x.
Charles
Hi Charles,
Example 1 tests whether the slope of the regression line is zero. The excel formula shows a one-tailed test with alpha=0.05, but surely this is a two-tailed test and the t-critical value formula should be ‘=TINV(0.025,E11)’. Please could you confirm either way?
David,
TINV(p,df) is a two tailed inverse; it is equal to T.INV(1-p/2,df), which is a one-tailed inverse.
Charles
Hi Charles,
Thank you for explaining the Excel function – I should have read the Excel Help.
David
Hi, how would i carry out a Hypothesis test for the slope and intercept coefficients once i have the regression results in excel?
Adam,
Just look at the p-value for the slope coefficient (or intercept) in the regression analysis. If the p-value is less than alpha then the slope (or intercept) is significantly different from zero.
Charle
Dear Charles
Many thanks for building this platform that is really help for me.
Recently, I do a mutual fund performance test, the objective is to compare whether the difference between two groups’ pooling regression intercept terms (mutual fund risk-adjusted returns) is significantly different than zero. Before I ask this question, I consult some websites, such as, http://core.ecu.edu/psyc/wuenschk/docs30/CompareCorrCoeff.pdf, however, it only show a single factor model as an example, in our case , I am not sure how to dial with the M(2,1) and M(2,2) in page 3 because my regressions are multi-variable model. Then, my question is, whether I can use your approach “Testing the significance of the slope of the regression line” to test the difference in intercept is significant or not from two independent sample regressions?
Edward,
I have not yet addressed this issue in the Real Statistics website, but I will eventually do so. You can learn how to do this from the textbook written by Zar. See the Bibliography for a reference.
Charles
Dear Charles
would you let me know how to compare three and more nonlinear regression lines which are not mostly in a fully common interval?
Shima,
To test whether two linear regression lines have the same slope, see the webpage
https://real-statistics.com/regression/hypothesis-testing-significance-regression-line-slope/comparing-slopes-two-independent-samples/
The issue you are raising is to “compare three and more nonlinear regression lines…” You need to explain what you mean by “compare”, namely what characteristics of the lines are you trying to compare? Also, the class of non-linear regression lines is vary broad, which ones are you referring to?
Charles
Charles
Hi Charles,
is there a way to test if 3 or more linear regression lines have the the same slope?
I am currently trying to test for differences in slopes between 4 linear regression lines.
Thanks,
Roger
Roger,
Yes, you can use the test for equal slope lines used in ANCOVA. See the following webpage
Assumptions for ANCOVA
Charles
Hi, Charles , thanks for your hopeful post.I’ve done follow your steps and it’s very useful, but I have one confusion is where is the ” Regression data analysis tool”.Looking for your reply, thanks a lot 🙂
You can access Excel’s Regression data analysis tool from the Data ribbon, via Data > Analysis|Data Analysis.
You can access the Real Statistics version of this data analysis tool by pressing Ctrl-m and choosing Regression.
Charles
Hi, great info- I’m having trouble understanding why the value for degrees of freedom in the first screenshot is the sample size minus 2 instead of n-1?
Lindsey,
It is simply the way the mathematics works out.
Charles
Please explain to me the rule of thumb for significant testing of the regression estimate of a slope.
I don’t know of any good rule of thumb here.
Charles
Hello
Thanks for the helpful website and nice explanations. It might be a stupid question, but I was wondering how I can check and see if the slope of my regression line is significantly different from “1” (instead of zero), and the intercept is different from zero.
Thanks,
Not a stupid question at all. There are probably a number of ways of doing this, but here is one approach.
Consider the linear equation y = bx + a. First note that the linear equation y = (b-1)x + a has slope of zero if and only if b = 1. Next note that y = (b-1)x + a is equivalent to y’ = bx + a where y’ is y+x. Thus you need to perform the usual test for slope = zero using the original x data, but with the y data replaced by the original y data plus the corresponding original x values. Thus if your original x data were 4, 6, 9, 14 and your original y data were 14, 25, 36, 55, you perform the test for zero slope using x data 4, 6, 9, 14 and y data 18, 31, 45, 69.
Since the intercept didn’t change you simply use the usual test for intercept = zero, as shown in Example 2 of Confidence and Prediction Intervals.
Charles
Hi Charels:
I am thinking of how can I interpret the slope with significant different from the a constant, when the constant is not equal to zero. When the significant different from zero, we can know there is a linear relationship, but how can we interpret when it is not zero. For example, when it is asked to test whether the slope significant different form 1 or not and then make an explanation.
Thanks,
Sherry
Sherry,
I would use the fact that the line y = bx + a has slope b = 1 if and only if the line (y-x) = (b-1)x + a has slope 0. Thus you need to test y’ = b’x + a where y’ is y – x.
Charles
Hi,
Thank you for the post.
I am trying to generate a calibration curve consisting 5 data points. I have six sets of replicate measurement data. Now I am wondering, what is the best approach of finding/reporting standard deviations of slope and intercept: a) get single data set by averaging values from replicate measurements and use LINEST function or b) obtain 6 slope and intercept values by plotting each data set of replicate measurement separately and calculate standard deviations of slopes and intercept.
Also, how can I calculate confidence interval if the approach (a) is used?
I have similar set of data obtained for slightly different condition and I need to compare if resulting slopes for these two different conditions significantly different?
1. Are you measuring the same set of 5 data points six times? In case (b) what do you plan to do with the slope and intercept values that you calculate?
2. Regarding finding the confidence interval, please look at the following webpage:
https://real-statistics.com/multiple-regression/confidence-and-prediction-intervals/
3. Regarding comparing slopes, please see the following webpage:
https://real-statistics.com/regression/hypothesis-testing-significance-regression-line-slope/comparing-slopes-two-independent-samples/
Charles
Hi! Thank you for your site, I find it very useful. I have a question about linear regression. I have performed a test to check correlation between two variables. For this test, 11 points were taken 4 times each (i.e. at the temperature of 4.5, the replicates were 4, 7, 6.5, 8.1). If I check for significance of a correlation between the average of each point (11 points on the curve) I can’t reject the null (p=0.073). However, if I use all 44 points I can reject the null (p=0.0005). I am wondering which treatment is correct and why? Thank you in advance.
One of the assumptions for linear regression is that the observations are independent. In the 44 point case, you clearly don’t have independent observations (since there are 4 measurements for each of the 11 points).
Charles
Hi. thanks for your useful and clear explains.
I’ve used Eviews software to estimate an independent variable as a function of 8 independent variables. the R^2 for my model is high (0.72) but the t value for my parameters of independent variables are too low (in some cases less than 0.001).
I want to know should I remove variables with low t value? and is R square more important compared to t value?
The R^2 value is a measure of the overall fit of the model. The p-value (not the t statistic) of each coefficient is a measure of weather the corresponding variable is contributing much to the model. You can remove a variable whose corresponding p-value is not significant (this indicates that the corresponding coefficient is statistically equivalent to zero). You could remove such variables from the model and see what impact this has on the R^2 value. This is explained on the webpage
Significance regression model variables
Charles
Hi Thanks for the post. It is very helpful. I need to calculate LOQ and LOD for my work. I used ICH guideline about standard deviation of y-intercept/slope to calculate LOQ and LOD. I used regression analysis and get the standard error of y-intercept (3rd table). I also calculated the STEYX. The two data do not match. Do they suppose to match? I am very confused. Also ICH calls for standard deviation but bot 3rd table and STEYX have the name of standard error instead of deviation, but I searched online and everybody said they are same thing. Can I send you the excel file.
Vicki,
Sorry that I missed your comment earlier. You can send me your Excel file.
Charles
hi, i was just wondering on how do i know which independent variables are significant and which are not?
There are a few ways at looking at this issue:
1) Check which variables have regression coefficients that are significantly different from zero. To do this you need to look at the p-values for the regression coefficients. Those that have p-value < alpha are significant. You can do this as described in the following places: Figure 3 of Multiple Regression Analysis in Excel
Figure 2 of Real Statistics Capabilities for Multiple Regression
2) Determine which independent variables can be removed from the regression model with no significant difference in the result. See the following webpage for more information about this:
Testing Significance of Variables in the Regression Model
Charles
Under Figure 3 below Summary Output I believe R Square – correlation of determination should be “coefficient of determination” Also, does the Real Statistics Data Analysis Tools offer variance inflation factor for linear regression? Or a scatterplot matrix feature to check for multicollinearity?
Ryan,
Thanks for catching the error. I have just changed the webpage to say “coefficient of determination”.
Regarding collinearity, please check out the webpage https://real-statistics.com/multiple-regression/collinearity/. The Real Statistics Resource Pack provides the VIF function for calculating the variance inflation factor.
Charles
Hello
I am doing multiple regression in Excel 2007. I have a one Dependent Data and 18 independent Data. But i am not to finding multiple regression at the time in all my Data.
Its give warning message like this, Only 16 column are available. can you please give me solution.?
Excel’s Regression data analysis tool is limited to 16 independent variables. You can use the Real Statistics Linear Regression data analysis tool instead. This tool supports up to 64 independent variables and is part of the Real Statistic Resource Pack, which you can download for free from this website.
Charles