Worksheet Functions
Real Statistics Functions: The Real Statistics Resource Pack supplies the following functions. Here R1 is an n × k array containing the X sample data and R2 is an n × 1 array containing the Y sample data.

You can use the R2 argument with each of the df functions above, although this parameter is not used. Similarly, you can use SSRegTot(R1, R2) and its value will be equivalent to SSRegTot(R2).
There is also a second form of the RSquare function in which RSquare(R1, j) = R2 where the X data consist of all the columns in R1 except the jth column, and the Y data consist of the jth column of R1.
R-square
As we observed elsewhere
![]()
It turns out that R2 = RSquare(R1, j) can also be calculated by first finding the correlation matrix for R1, then taking its inverse, and then selecting the jth element on the diagonal. If this has the value c then the desired value of R2 is the square root of 1–1/c.
Thus R2 can also be calculated by the formula:
=1–1/INDEX(DIAG(MINVERSE(CORR(R1))),j)
Worksheet Array Functions
Real Statistics Functions: The Real Statistics Resource Pack contains the following array functions. Here R1 is an n × k array containing the X sample data and R2 is an n × 1 array containing the Y sample data.
DESIGN(R1) = n × (k+1) design matrix
HAT(R1) = n × n hat matrix
DIAGHAT(R1) = n × 1 column array containing the diagonal of the hat matrix
CORE(R1) = (k+1) × (k+1) matrix (XTX)-1 which makes up the core of the hat matrix
RegCov(R1, R2) = (k+1) × (k+1) matrix MSRes(XTX)-1 which is the covariance matrix for the regression coefficients
RegCoeff(R1, R2) = (k+1) × 2 array, whose first column consists of the coefficient vector B and whose second column consists of the corresponding stand errors.
RegCoeffSE(R1, R2) = (k+1) × 1 column array of the standard errors of the coefficient vector B
RegY(R1, R2) = n × 1 column array of predicted values Y-hat for Y.
RegE(R1, R2) = n × 1 residuals vector
RegCoeffCI(R1, R2, head, , alpha) = (k+1) × 6 array, whose first two columns are as for RegCoeff, and whose other columns contain the t-stat, p-value and 1-alpha confidence interval. alpha defaults to .05.
If head = TRUE (default FALSE) then the first row of R1 and R2 consist of column headings, and these are used as row labels in the output. The output also contains column labels, and so the output is a (k+2) × 7 array.
For the example shown in Figure 3 below, the output in range E18:K21 can be produced using the array formula =RegCoeffCI(A3:B14,C3:C14,TRUE). Alternatively, you can use =RegCoeffCI(A4:B14,C4:C14) to produce the output in range F19:K21.
RegCoeffCI can take an optional fourth argument (sim). When set to TRUE, simultaneous confidence intervals are produced. In this case, the output does not contain the t-stat and p-value. See Multivariate Regression Coefficient Confidence Intervals for details.
Data Analysis Tool
Real Statistics Data Analysis Tool: The Real Statistics Resource Pack provides a data analysis tool whose output is similar to that of the Excel Regression data analysis tool shown in Figure 5 of Multiple Regression Analysis in Excel, except that, as usual, the output will contain formulas instead of values. In this way, if you change any of the input data, the output will automatically be updated without having to rerun the data analysis tool.
To use the tool for Example 2 of Multiple Regression Analysis in Excel, you perform the following steps: Press the key sequence Ctrl-m and double click on the Regression option in the dialog box that appears and then select Multiple linear regression from the list of options (see Figure 1).
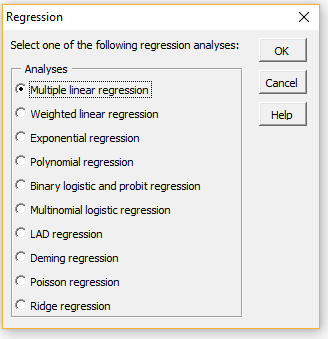
Figure 1 – Regression dialog box
Alternatively, when using the multipage user interface, click on the Reg tab and then select the Multiple Linear Regression option. In either case, a dialog box will then appear as shown in Figure 2.
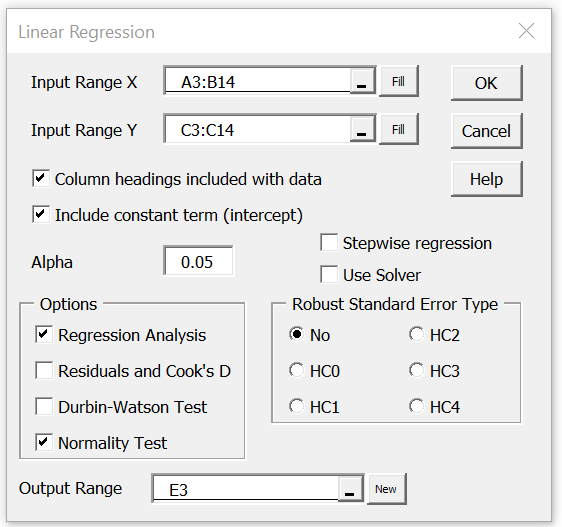
Figure 2 – Dialog box for Linear Regression data analysis tool
Now enter A3:B14 for Input Range X and C3:C14 for Input Range Y, make sure that the Column Headings included with data and Include constant (intercept) options are checked, retain the value .05 for Alpha, select the Regression Analysis and No Robust Standard Errors options and click on OK. The output appears in Figure 3.
Since the Y data is contiguous with the X data and follows the X data, alternatively you can enter the range A3:C14 in the Input Range X field and leave the Input Range Y field blank. The results will be the same.

Figure 3 – Real Statistics Linear Regression Data Analysis
Restrictions
The Excel Regression data analysis tool is limited to 16 independent variables. The LINEST function supports up to 64 independent variables. The various Real Statistics functions and the Real Statistics Linear Regression data analysis tool described above will support many more than 64 independent variables (in fact, these tools are limited by the size of the largest matrix that can be inverted using MINVERSE).
Examples Workbook
Click here to download the Excel workbook with the examples described on this webpage.
References
Howell, D. C. (2010) Statistical methods for psychology (7th ed.). Wadsworth, Cengage Learning.
https://labs.la.utexas.edu/gilden/files/2016/05/Statistics-Text.pdf
Dear Charls,
I did regression analysis for the development of volume equation for trees. I tested different models of tree volume based on diameter alone and on diameter and height both. I calculated different coefficients i.e. a, b, c, etc. and R^2 for every model by using solver tool of excel. Following are the models:
One way (based on diameter alone)
1. V = a + bD
2. V = a + bD + cD^2
3. V = a + bD^2
4. V = aD + bD^2
5. V = aD + bD^-1
6. V = aD + bd^-2
7. log(V) = a + bD
8. V = a + b log(D)
9. log(V) = a + b log (D)
Two way (based on diameter and height)
10. V = a + bD^2H
11. V = a + bD + cH
12. V = a + bD + cD^2H
13. V = a + bD + cDH
14. V = a + bD + cH + dDH
15. V = a + bD + cH + dD^2H
16. V = a + bD^2 + cH + dDH
17. V = a + bD^2 + cH + dD^2H
18. V = a + bD^2 + cDH + dD^2H
19. V = a + b log(D) + c log(H)
20. log(V) = a + b log(D) + c log(H)
21. V = a + bD^-1 + cH^-1
Where,
V = Volume, D = Diameter at Breast Height, H = Height of tree, a, b, c, d = coefficients
I have generated ANOVA tables (to know the Standard Error of coefficients) by using Regression option for model 1 (linear), model 2 (binomial) and model 11 (multiple linear regression) but i am not able to generate ANOVA table for rest of the models.
Is there any option in real-statistics or in excel to generate ANOVA table for rest of the models?
Hello Ajay,
1. You can use polynomial regression for models 2, 3, 4 and 6, See
Polynomial Regression
2. Multiple linear regression can be applied for models 11, 13 and 14Real Statistics Regression/ANOVA Functions
3. Models 12, 15, 16, 17 and 18 can also be fit using multiple regression. As explained in the above-referenced webpage, multiple regression can also handle the variable D^2.
4. The other models can be fit using non-linear regression. These models can be fit using Excel’s Solver. An example of how to do this is shown at
Exponential Regression using Solver
5. Models 7, 9 and 20 can be handled (with modification of the constant term a) as described at
Power Regression
Charles
How could we make a scatter diagram with multiple variables.what should be the minimum sample size for seven independent variables how regression coefficients are interpreted
1. Use the Real Statistics Multiple Scatter Charts data analysis tool (on the Desc tab). See
https://real-statistics.com/correlation/scatter-diagrams/
2. Use the Real Statistics Statistical Power and Sample Size data analysis tool (on the Misc tab), selecting the Multiple Regression option
Also, see the following webpage https://real-statistics.com/multiple-regression/statistical-power-sample-size-multiple-regression/
Charles
Is there a way to see the predicted R^2 via this toolkit?
Yes. You can use the RSquare function or the Linear Regression data analysis tool.
Charles
Dear Charles,
Please help. The R and R**2 values I obtained from the data analysis
output (via cntl m) is different from the values I obtained using the functions
MultipleR and Rsquare
Hello Jonathan,
If you email me an Excel file with your data and calculations, I will try to figure out why the answers are different.
Charles
Charles,
There are some typos in denoting the column vectors of the Real Stat array functions of RegY(R1, R2) and RegE(R1, R2): it should be described as an n x 1 column vector instead of (k+1) x 1 vector for both.
About an alternative way to calculate the R Sqaure, I have 2 comments:
1. The R^2 formula is given by
=1–1/INDEX(DIAG(MINVERSE(CORR(R1))),2). When I use the formula, the calculate value is not the same as the correct R square value.
The CORR(R1):
1 -0.333941973
-0.333941973 1
The inverse of the above correlation:
1.125514244 0.375856447
0.375856447 1.125514244
Therefore, the final value becomes 0.111517241.
2. In the prior paragraph, the R square should be the square root of 1- 1/c. If this is the correct statement, should the square root be applied to the formula? The square root value is 0.333941973, which is still not the correct R square value (0.850693971).
Please help me resolving the discrepancy.
-Sun
Hello Sun,
Yes, RegY(R1, R2) and RegE(R1, R2) should be described as an n x 1 column vector. Thanks for identifying this error. I have now changed this on the webpage.
=1–1/INDEX(DIAG(MINVERSE(CORR(R1))),2) returns the R-square value for the regression of the 2nd variable (i.e. column) in R1 on all the variables in R1 except the 2nd variable. This will give the same value as =RSquare(R1,2). Note this is not R-Square value of the full regression.
Charles
Hi Charles,
Thanks for this incredible toolkit!
I am doing a stepwise multiple regression with independent variables A, B (which is a 0,1 dummy code), and A*B (interaction term), and DV of course as Y. When I select stepwise, the A*B term does not display on the output. (I checked to make sure it was included in the IV set.) I am assuming it is not displayed because it was not significant. Is that in fact true? There is no way for me to tell as no statistics are displayed for that effect. Appreciate your help.
Hi Steve,
I am not able to answer your question without seeing your data.
If you send me an Excel file with your data and regression output, I will try to answer your question.
Charles
Hi Charles,
Many thanks for this tool. It is unbelievably useful in calculating complex stats I can’t get my head around and the resource is excellent.
I’m trying to process a multiple regression analysis for multiple surgical factors (such as age, number of stitches, type of stitches used etc) affecting the length of a surgical scar but every time I put the details in as above, I receive a “Compile error in hidden module: Regression” message. Any ideas?
I’m using excel 2011 for mac (oddly enough I’ve used this before about 4 years ago and it worked fine but not any more…)
Richard
Hi Richard,
Is Solver installed and enabled? To check this, select AddIns from the Tools menu. Solver should be on this list of addins with a check mark next to it.
Charles
HI Charles,
Please explain and suggest functions for Shelf life calculation ( as per USFDA guidance) using excel.
Rajesh,
I am not familiar with the shelf life calculation.
Charles
Ok Charles,
Please explain how to do multiple regression with e.g Batch( x1 categorical variable)and month (x2) as independent variable and one Y as dependent variable.
I tried to calculate but failed. Please share your mail ID if possible to communicate my problem in detail.
Rajesh,
You can find my email address at Contact Us
Charles
Hi Charles
Hope you are well.
Just wondering – I know the analysis tool produces residuals and standardised residuals. However, if I want to establish linearity, should I be looking at generating scatter plots of the former or the latter? Got confused when I looked at Tabachnick and Fidell’s resource and coudl really use the help. Thanks.
Demos,
A scatter plot of the residuals should be random not linear. You should make a series of scatter plots of the original data: one plot for the data of each independent variable vs the data of the dependent variable. These should look linear.
In the next release of the Real Statistics software, there will be a data analysis tool that does all of this automatically.
Charles
Thanks Charles! So if I want to establish homoscedasticity, would I not need to check the residuals?
Demos,
Yes, to establish homoscedasticity, you should check the residuals.
Charles
Hi,
In the figure 3, what are the coefficients “AIC”, “AICc”, and “SBC”? I could not find any explanation for those. Are they Akaike information criterion and Schwarz Bayesian information criterion?
Riikka,
Yes, these are Akaike information criterion and Schwarz Bayesian information criterion, as explained on the following webpage:
https://real-statistics.com/multiple-regression/testing-significance-extra-variables-regression-model/
Charles
Is there a way to perform weighted linear regression with the real-statistics tool pack?
Eugen,
I have not implemented weighted regression yet in the Real Statistics Resource Pack. I plan to do so in the future. If you can tell me the specific analysis you are trying to perform, perhaps I can give you a work-around (probably by modifying the input data).
Charles