Basic Concepts
In an unbalanced ANOVA, the sample sizes for the various cells are unequal. Provided the cell sizes are not too different, this is not a big problem for one-way ANOVA, but for factorial ANOVA, the approaches described in Factorial ANOVA are generally not adequate. In these cases, the regression approach described in ANOVA using Regression can be used instead.
Usually, when conducting a study, the intention is to create groups of equal size, but it is often difficult to maintain such equality, perhaps because one or more subjects pulls out of the study at the last minute or for some other reason. The technique we now review is appropriate when any differences in cell size are due to random factors.
If, for example, the cells correspond to questions in a survey and it turns out that some cell has fewer entries because many people were offended by the question or found the question ambiguous or too difficult and so didn’t answer the question, then this is not a random difference in cell size, and so the approach given here is not applicable. In fact, in this case, the survey should be redesigned unless the fact that the question was unanswered is being tested for and so a non-answer could be considered as a type of response, in which case we can use a balanced model.
Example
Example 1: Perform ANOVA for the situation in Example 2 of ANOVA using Regression on the sample data in the table on the left side of Figure 1 using multiple regression.

Figure 1 – Data for plus coding of dichotomous variables
We also provide a coding for the data in Figure 1. As you can see, the cells are unequal in size. Since we assume that any differences are due to random factors, we would like to treat each cell as having equal weight. In such cases, we are better off assuming that the row means are simply the average of the cells in each row and similarly for the columns. Thus we have the following modified means:

Figure 2 – Means with equal weights
Regression model
The regression model takes the form
![]()
Using the same approach as in Example 1 of ANOVA using Regression, ignoring the error term, we see that
![]()
![]()
![]()
![]()
![]()
![]()
![]()
![]()
Since the population grand mean is the sum of the terms on the left sides of the above six equations divided by 6, we see that the grand mean is the sum of the terms on the right side of the above equations divided by 6. This turns out to be β0, i.e. β0 = μ. Similarly,
![]()
![]()
and so
![]()
Thus we conclude that β1 = μX – μ.
From
![]()
it follows that β2 = μCorn – μ. Similarly, β3 = μSoy – μ.
Since
![]()
we have
![]()
and similarly
![]()
We summarize these results as follows:
- β0 = population grand mean
- β1 = population effect for Blend X group (i.e. group mean – grand mean)
- β2 = population effect for Corn group
- β3 = population effect for Soy group
- β4 = population effect for Blend X × Corn interaction (i.e. Blend X × Corn mean – Blend X group mean – Corn group mean + population grand mean)
- β5 = population effect for Blend X × Soy interaction
The coefficient table from Excel’s Regression data analysis tool is shown in Figure 3.

Figure 3 – Coefficients from regression analysis for Example 1
Note that these coefficients can be obtained using the weighted means from Figure 2 as follows:
- β0= sample grand mean = 152.62
- β1 = sample Blend X group mean – grand mean = 149.2 – 152.62 = -3.42
- β2 = sample Corn group mean – grand mean = 147.5 – 152.62 = -5.12
- β3 = sample Soy group mean – grand mean = 157.38 – 152.62 = 4.76
- β4 = Blend X × Corn mean – Blend X group mean – Corn group mean + grand mean = 135.4 – 149.2 – 147.5 + 152.62 = -8.68
- β5 = Blend X × Soy mean – Blend X group mean – Soy group mean + grand mean = 171 – 149.2 – 157.38 + 152.62 = 17.04
Multiple regressions
To create the ANOVA we proceed in a manner similar to what we did in Example 2 of ANOVA using Regression. The output, using the Regression data analysis, for the full model, i.e. α + β + αβ, where α, β and αβ (= δ) are as defined in Definition 1 of Two Factor ANOVA with Replication, is as follows:

Figure 4 – Regression analysis for the complete model
We now run the regression analysis with only t1, t2, and t3 (no interaction terms) to obtain the α + β model, and then run the analysis with t1, t1 * t2, and t1 * t3 to obtain the α + αβ model. Finally, we run the analysis with t2, t3, t1 * t2, and t1 * t3 to obtain the β + αβ model. Although we don’t show the output for each of these models, we summarize the key results in the upper portion of Figure 5.
But A = (α + β + αβ) – (β + αβ), B = (α + β + αβ) – (α + αβ) and AB = (α + β + αβ) – (α + β), and so we obtain the values for the SSReg, dfReg and R Square for A, B and AB (the lower part of Figure 5) from the values in the upper part of Figure 5.

Figure 5 – Regression analysis for partial models
Note too that
![]()
and similarly for the other terms in the table above.
Results
Using these facts, we can obtain the output for ANOVA as shown in Figure 6. The values for Rows (A), Columns (B), and Interaction (AB) come from Figure 5. The Within values come from the values for SSRes, dfRes, MSRes in the complete regression model (Figure 4). The Total values also come from the values in Figure 4.

Figure 6 – ANOVA output for Example 1
Note that SSA + SSB + SSAB + SSW = 14513.90 < 14702.07 = SST, since the above model doesn’t quite account for all the variation. While in the balanced model A, B, and AB partition the total variation, in the case of unbalanced models A, B, and AB overlap. The model we have given leaves out the overlap, but corresponds to the approach of equally weighting the cell means.
From the analysis, we see that there are no significant differences between the Blend or Crop means, but there is a significant difference in the Interactions. We can now perform the usual comparison t-tests to further investigate these differences.
Data Analysis Tool
Real Statistics Data Analysis Tool: The Two Factor ANOVA data analysis tool provided by the Real Statistics Resource Pack contains a Regression option that automates the above procedure. If the input data is in Excel Two Factor ANOVA format the data is first converted to standard format and the appropriate regression models are generated.
For example, to perform the analysis for Example 1, click on cell F1 (where the output will start), enter Ctrl-m, and select the Two Factor ANOVA option from the Anova tab (or from the menu that appears if using the original user interface).
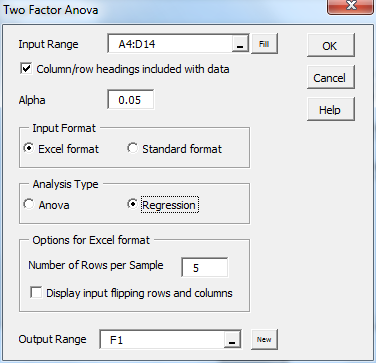
Figure 7 – Dialog box for unbalanced Anova models
When the dialog box in Figure 7 appears, enter A4:D14 in the Input Range, click on Column/row headings included with data, select Excel format as the Input Format, select the Regression as the Analysis Type, and click on the OK button. The output is shown in Figures 8 and 9.
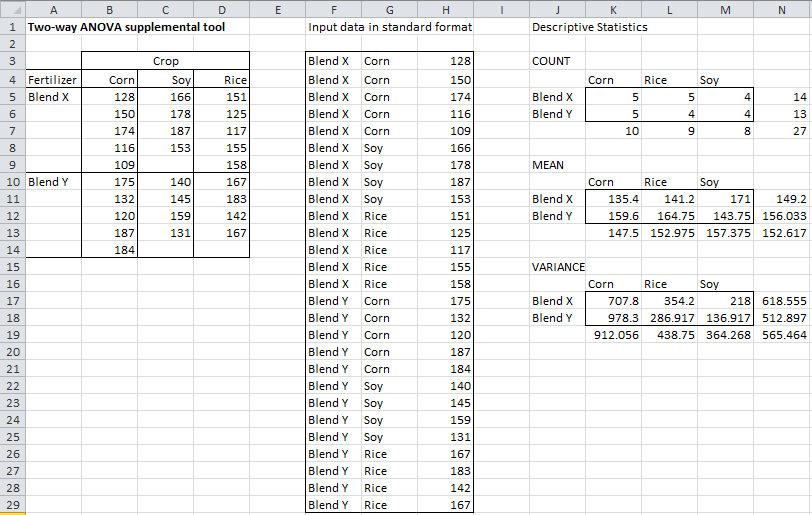
Figure 8 – Unbalanced Two Factor ANOVA (part 1)
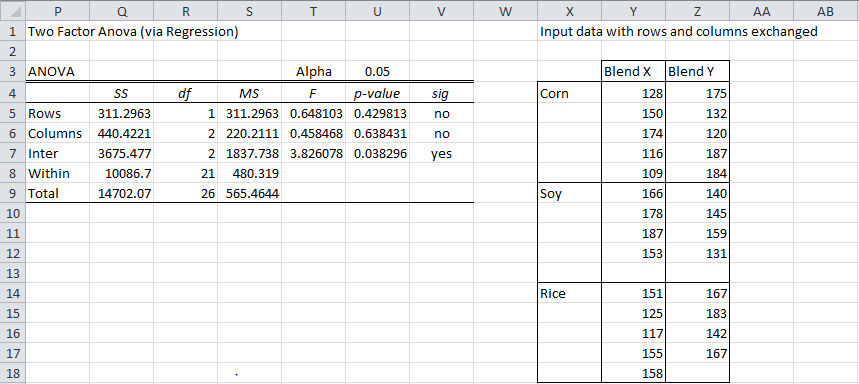
Figure 9 – Unbalanced Two Factor ANOVA (part 2)
The first step in the analysis is that the input data is converted to standard format. The usual descriptive statistics are then calculated and the regression form of analysis of variance is computed. Finally, the rows and columns of the original input data are exchanged to facilitate follow-up tests.
If the input data had been in standard format the analysis would have proceeded in a similar manner, although no conversions would have been performed.
Observations
The approach described on this web page requires that all the interactions have at least one element in common. E.g. in Figure 8, if one of the cells in the range K5:M6 contains a zero value, then the output from the analysis will be in error.
When the Regression option of the Two Factor ANOVA data analysis tool is chosen you are limited to 64 independent variables (i.e. the same limitation as the Linear Regression data analysis tool described in Multiple Regression Analysis). This means that if a = the number of levels for factor A and b = the number of levels for factor B, then ab can be at most 64.
The approach described here for two-factor ANOVA can be extended to ANOVA with more than two factors. In Three Factor ANOVA using Regression we show how this is done.
Examples Workbook
Click here to download the Excel workbook with the examples described on this webpage.
Reference
Howell, D. C. (2010) Statistical methods for psychology (7th ed.). Wadsworth, Cengage Learning.
https://labs.la.utexas.edu/gilden/files/2016/05/Statistics-Text.pdf
Hello Charles,
I am having following samples analyzed for chemical content
1. Fresh samples
2. samples stored at 10 degee celcius for 1, 2,3,4,6,12 day
3. samples stored at 25 degee celcius for 1, 2,3,4, and 6 day
4.samples stored at 35 degee celcius for 1, 2, and3 day
i want to check the effect of temperature, storage time and their interaction on chemical content. which statistical method i should use
Hello Pam,
The usual approach would be regression or repeated measures ANOVA. The problem is that the samples are stored for a different number of days. Thus, there is a lot of missing data.
How many samples do you have of each of the 4 types?
Charles
Hello Charles,
Fresh samples – 3 samples (Replication)
2. samples stored at 10 degee celcius for 1, 2,3,4,6,12 day (3 samples each day = 18)
3. samples stored at 25 degee celcius for 1, 2,3,4, and 6 day (3 samples each day = 15)
4.samples stored at 35 degee celcius for 1, 2, and3 day (3 samples each day = 9)
would it possible to see the effect of temperature, time and their combination
Hello Charles,
Fresh samples – 3 samples (Replication)
2. samples stored at 10 degee celcius for 1, 2,3,4,6,12 day (3 samples each day = 18)
3. samples stored at 25 degee celcius for 1, 2,3,4, and 6 day (3 samples each day = 15)
4.samples stored at 35 degee celcius for 1, 2, and3 day (3 samples each day = 9). the total sample for 4 types is 45
would it possible to see the effect of temperature, time and their combination
Hello Pam,
The usual approach would be regression or repeated measures ANOVA. The problem is that the samples are stored for a different number of days. Thus, there is a lot of missing data.
Since type 2, 3, and 4 all have data for days 1, 2, and 3, perhaps you can use regression or repeated measures ANOVA for these 18+15+45 = 78 samples. This would leave you with trying to figure out what to do about 0, 4, 6, or 12 days. Of course for 12 days you only have data for 10 degrees. You have similar problems for 0 days. For 6 days you can use the data for 10 and 25 degrees,
Charles
Hello Charles,
Thank you very much for your reply.
Hi Charles,
With your excellent introduction for unequal sample size ANOVA SS calculation by using general linear model, I understood these completely, I’m truly grateful for all your hard work.
Best Regards,
Mike
Glad I could help, Mike.
Thanks for your comment.
Charles
Dear Charles,
I am doing a 2-factor Unbalanced ANOVA. The Two factors can have only 2 conditions each, so in total I have 4 sub-groups.
Bot normality for all sub-groups as well as homogeneity of variances assumptions are satisfied, however the test is unbalanced, as the 4 sub-groups have size: 6 – 11 – 14 – 17 samples.
If I apply usual 2-Factor ANOVA, I get a strongly significant interaction (p << 0.001), but if I apply ANOVA by Regression, the interaction is not significant (p =0.51)
I don't undesrtand why so large difference in results, which result should I trust more?
Thank you very much.
Best Regards
Piero
Piero,
If you have an unbalanced model, you need to use the regression approach.
Charles
Dear Sir Charles,
I worked on a project in which we are evaluating the combined effect of different fertilizers (factors C, PH, SEA, SI, MY) and different irrigation regimes (factors 100, 50, 25) on the pH and Brix values of strawberries. Unfortunately, we have unbalanced sample size and therefore I tried running two way anova with regression as suggested here, but sadly things don’t seem to work out well. When I select the input range, the program gives back wrong values and it excludes the first factors (instead of C, PH, SEA, SI, MY, I get 0,PH,SEA,SI,MY and instead of 100, 50,25 I get 0,50,25). Do you have an idea of the reason behind this issue? thanks.
Hello Francesco,
If you email me an Excel file with your data and test results, I will try to figure out what is going wrong.
Charles
Hi Charles,
First I would like to thank you for the excellent software toolbox you have written. It makes live much more easy.
At the moment I am working on a precision statement for an analytical test method based on data from an inter laboratory study. The data set consists of 10 samples which are analysed in duplo (repeated) by 12 laboratories. After removing outliers and transforming the dataset to force uniformity of between and within laboratory variance, the data set is no longer complete. The data is unbalanced due to the empty cells, so a regular 2 way repeated ANOVA is no longer the appropriate tool. I checked the ANOVA via regression and this works fine for the data set where at least a single result is present for all laboratory/sample cells. However, when both the repeated results of a laboratory for a sample is missing or removed, the ANOVA via regression is no longer giving results. Do you have a suggestion what the options are to get the ANOVA table for calculating the precision?
Thank you very much and greetings from The Netherlands,
Erik
Hello Erik,
Good to hear from someone from the Netherlands. With the Covid-19 crisis, friends that I have from the Netherlands have been unable to come to Italy, where I live.
If you email me an Excel file with your data, I will try to figure out whether this analysis is possible.
Charles
I had a query as to how we can perform two -way anova without replication for the same dataset(unbalanced form) in excel and how can we check whether there is any interaction term or not?
Hello Shila,
If you look at Figure 1 on https://real-statistics.com/two-way-anova/two-factor-anova-without-replication/
essentially what you are asking is can you perform two-factor ANOVA where one (or more) of the cells is zero. I just tried it and it worked using the regression approach.
If some cell in Figure 1 contains more than one entry then there is an interaction term.
Charles
Hello Charles,
I have a similar question to example 1, unbalanced two factorial ANOVA. I tested example 1 with the macros, it gave an error message with “compile error in hidden module: AnovaAnalysis”. The macros I downloaded has seven analysis types, and I chose Anova – Regression for testing.
I will really appreciate your kind help. Thank you so much.
You need to download and install the Real Statistics software to use the two factor ANOVA data analysis tool with unbalanced data. See
https://real-statistics.com/free-download/real-statistics-resource-pack/
Charles
Dear Sir,
Thank you so much. It works now.
Hi Charles,
I have three years data (two years data is recorded on 2 replications, while one year data is based on single replication). I want to perform ANOVA, But it seam impossible for me. Please guide me how I can do this.
A16-1, A16-2, A17-1, A18-1, A18-2. Every
Hello Ahmad,
Does this mean that you have a total sample of size 5? What hypothesis are you trying to test?
Charles
Dear Sir,
I have tried this unbalanced two way factorial ANOVA. But problem is in each groups rows are also not same.
Then how to solve this problem.
In Example 1 the group rows are not the same. Can you give me a simple example where you are having a problem or email me an Excel file with your data?
Charles
Sir, I have installed the Real Statistics software package. Now I want to know how to apply the analysis function to my data? Which model I should use?
Ahmad,
This depends on the type of data that you have.
Charles
Yes sir Sir. I want to calculate ANOVA, and H2 for this data.
What is H2?
Charles
Hello Charles,
My study involves two factors namely curing time(28 and 56 days) and percent replacement(0%, 5%, 10%, 15%, 20%). For curing time there are two groups: 28 days and 56 days. The sample size for all 28 day groups are 4 and sample size for all 56 day groups are only 3. Now, I want to determine if curing time has a significant effect. I plan on using this method. Is this test applicable to my study? Is my sample size already sufficient? Do I still need to test for normality and homogeneity of variances for each group?
Thanks Charles! I would really appreciate if you would answer my queries. Pardon if I have wrong terminologies, I’m an Engineering student by the way.
P.S. very great and helpful site, yet is free. Salute to you Mr.Zaiontz
Hello Karl,
Is your total sample size 7? In this case the Curing Time factor is a fixed factor, while Percent Replacement is a repeated measures factor (i.e there are measurements for 0%, 10%, 15% and 20% for each of the 7 samples). Is this correct?
Charles
Hello Charles,
Samples are independent of each other. My samples are concrete cylinders and I measure their compressive strength (dependent variable) using a destructive test, thus I have a sample for each percent replacement for both 28 days and 56 days. I have 3 samples for each percent replacement (independent variable) for the 28 day curing period and 4 samples for each percent replacement for the 56 day curing period. Percent replacement which is my first independent variable has values of 0% 5% 10% 15% and 20%. Curing period which is my second independent variable is either 28 days or 56 days. Now I want to determine if curing period has a significant effect to compressive strength. I’ve already made an interaction plot yet the trend does not seem to be uniform as on some percent replacement, compressive strength increased as curing period is increased while on other percent replacements the opposite happened. What test should I do? ANOVA using regression since I have an unbalanced model. If I’ll perform ANOVA using regression, do I still need to verify normality and homogeneity of variances?
Hello Karl,
If ANOVA is appropriate you will need to use regression and you will need to verify normality and homogeneity of variances.
Before deciding whether ANOVA is the correct test and which version of ANOVA to use, please specify which hypothesis or hypotheses you want to test_
Charles
I want to test if curing period has significantly affected compressive strength across different percent replacement.
Hello Karl,
I am trying to understand whether the two factor ANOVA approach is a fit for your data or that you need to use ANOVA with Repeated Measures. The key question I am trying to get an answer to is whether you have 7 samples and are testing each of these at the different percentages that you have specified.
Charles
Nope, There are 4 samples for each percent replacement for 28-day curing period. Thus there are a total of 20 samples for 28 day curing period. On the other hand, there are only 3 samples for each percent replacement for58 day curing period, thus a total of 15 samples. Effectively, there are 7 samples per percent replacement, with 4 samples cured for 28 days and 3 samples cured for 56 days. All in all there 35 samples in this study. Thank you Charles! I’m really sorry that I can’t explain my answers clearly.
Thanks Karl,
This clarifies things. Thank you.
It does seem like two factor ANOVA is appropriate and since the sample sizes are different, the regression approach is also appropriate.
Charles
Thank you very much Charles! You’ve been such a great help to me.
Last question, upon comparing homogeneity of variances using levene’s test, do I need to compare all sample groups at once? or separate sample groups into two groups depending on curing period, then employ levene’s test?
Hello Karl,
Since in Two Factor ANOVA you are usually interested in the interaction between the factors, you want to use Levene’s test on the interactions. See
https://real-statistics.com/two-way-anova/testing-two-factor-anova-assumptions/
Charles
If the former is true, is Kruskal-wallis the more appropriate method in comparing the absolute value of residuals since there is unequal sample sizes.
Karl,
I don’t see any reason to use Kruskal-Wallis. This test doesn’t even support factorial ANOVA.
Charles
Charles,
When I ran the unbalanced two factor ANOVA data using the Real Stat Analysis Tool, I was able to produce the contents presented in Figure 8, but not Figure 9. As I reported while back to you, the summary ANOVA table using regression table have undefined cells. For example, the SS between and SS within terms are undefined.
I had an impression that this exact issue was fixed in version 6.4.1.
Please advise.
-Sun
Hello Sun,
I just repeated using the Two Factor ANOVA data analysis tool (selecting the Regression option) and it worked perfectly, producing both the results in Figure 8 and 9. For Figure 9, the SS values were produced using the formula =SSAnova2(F3:H29). This is the version of the SSAnova2 function for data in standard format.
Are you using Rel 6.4.1?
Charles
Charles,
It was an error from my end. Instead of using the “Two Factor ANOVA” option, I used the repeated measures ANOVA….Somehow, I was confused the problem with repeated measures questions.
My apology for causing a confusion. Yes, the ANOVA-Regression option under the “Two Factor ANOVA” anaysis works fine.
Thanks,
-Sun
No problem.
Charles
Dear Charles,
The total sum of square in Fig 9 (Two Factor Anova(via Regression) is 14702.07.
The Sum of Square for Rows is 311.2963
The Sum of Square for Columns is 440.4221
The Sum of Square for Interaction is 3675.477
The Sum of Square for “Within” is 10086.7
The total of the above 4 sums of squares = 311.2963+440.4221+3675.477+10086.7 = 14513.8954
which is not equal to 14702.07.
Where has the sum of squares gone, 14702.7-14513.8954 =188.1746?
Dennis,
This is normal for unbalanced models.
Charles
Thank You
very much
Sir, Do not work Ctrl-M in excel.
Please help me.
Dharma,
What do you see when you insert the formula =VER() in any cell?
When you press Alt-TI do you see RealStats in the list of addins with a check mark next to it?
Charles
1. What do you see when you insert the formula =VER() in any cell?
=VER()= #NAME?
2. When you press Alt-TI do you see RealStats in the list of addins with a check mark next to it?
No
Dharma,
This means that you have not installed the Real Statistics software, and so nothing will work. It is not sufficient to download the software, you must install it as well.
Please go to the following webpage and follow the installation instructions:
Real Statistics Download Resource Pack
Charles
Dear Sir
I am currently PhD student of Tribhuvan University in Mathematics Education. I want to use the software and method prescribed by real statistics to analysis the data. If you provide me permission for using the software, I will be grateful and it will provide great support for my study.
Thank Yoy
Yoy,
As long as you abide by the License Agreement, you are free to use the Real Statistics software for any analyses that you like.
Charles
Thanks Charles, when I enter =ver() into a cell I get #NAME?
Tom,
This means that Real Statistics is not installed.
When you press Alt-TI do you see RealStats-2010 as well as Solver on the list of addins, both with check marks next to them? If they are on the list but without check marks, then you need to add the check marks. If not you need to click on the Browse button to add RealStats-2010 and Solver to the list of addins.
Charles
I have some uneven data sets and want to run ANOVA two factor with replication. I have downloaded the Addins and they are checked off on my Addins (Alt TI) but when I select ANOVA two factor with replication I do not have the Excel/Standard option in ANOVA. Any suggestions? I have Excel Version 10.
Tom,
If I understand correctly you are using Excel 2002, which is no longer supported by Microsoft. Although it is supported by Real Statistics, this version of Real Statistics is not being updated with new features. You will need to use Excel 2007, 2010, 2011, 2013 or 2016 to access these newer capabilities.
Charles
Sorry, I should have indicated that I am using Excel Version: 14.0.7194.5000 (32-bit)
Tom,
Thanks for this information. The latest version of the Real Statistics software does support Standard format for two factor ANOVA (as well as the past few preceding versions). The only reason I can think of for not finding the Standard format option is that you are looking at the standard Excel version of the ANOVA data analysis tool (which does not have this option) and not the Real Statistics version (which does). To access Real Statistics you can press Ctrl-m.
Charles
Hi Charles,
Realstats-2010.xlam was downloaded and added to C:\Program Files (x86)\Microsoft Office\Office14\Library .
The file appears in the Manage Add-Ins section from when accessed via Options -> Add-Ins. When enabled and Excel is restarted, the file I’m working with is loaded and when we go to ANOVA with replication, we see the standard version, not Realstats version.
Also, CTRL-M did not work either. The system is Windows 7 x64.
Thanks.
Tom,
Strange.
When you press Alt-TI do you see RealStats-2010 as well as Solver on the list of addins, both with check marks next to them?
Also when you enter the formula =VER() what do you see?
Charles
Hi Charles,
I work with Tom and administer the system in question.
When we run Alt-TI, we do see RealStats-2010 and solver enabled.
When we run =Ver() we get #NAME?
As a side note, I placed the Realstats-2010.xlam into C:\Program files (x86)\Microsoft Office\OFFICE12\Library. This was to ensure any security issues were taken care of by default. the users account was granted full rights to the file, to troubleshoot why we couldn’t see the dialog boxes.
Paul T.
Paul,
That =VER() is #NAME? means that Real Statistics is not installed.
Since when you press Alt-TI, you see that RealStats-2010 and Solver are enabled, this probably means that RealStats-2010 is not where Excel expects it. This would be the case if the RealStats-2010 file was moved.
I don’t know what the implications of putting the Realstats-2010.xlam into C:\Program files (x86)\Microsoft Office\OFFICE12\Library are.
I suggest that you uncheck RealStats-2010 and then rename Realstats-2010.xlam (located in C:\Program files (x86)\Microsoft Office\OFFICE12\Library), e.g. call it RealStats.xlam. Now press Alt-TI (in Excel) and click on Browse to locate the file. Etc. If this doesn’t work, move the file to the recommended location and start again.
Charles
Hi Charles,
We relocated the file to the users account. We had followed the other troubleshooting instructions as per your page, but it did not like being in the default Library folder.
We have it working now.
Thanksm
Paul T.
Paul,
That is good to hear. Glad you were able to get it working.
Charles
Thank you very much!
Hi Dr
Did you think this below table is suitable for the two-way unbalanced ANOVA?
Straw management Nitrogen management
N0 N150 N300 N200+M100 N200+W100
Straw return 23.8 25.3 35.6 27.9 27.7
20.8 24.9 28.2 32.0 35.0
21.8 25.6 28.4 35.4 31.4
Straw removal 16.6 19.2 24.9 None None
19.7 26.4 24.0 None None
18.1 26.9 25.8 None None
Note: N0 means chemical nitrogen input rate is 0 kg N ha-1 yr-1; M100 and W100 means manure nitrogen and waste nitrogen input rate is 100 kg N ha-1 yr-1, respectively.
Tao,
The unbalanced model still needs data. That the last two columns for Straw removal are completely empty will likely cause a problem.
Charles
Thank you very much.
However, i hear from a reviewer that these data could used to two-way unbalanced ANOVA analysis by R studio. How about you think?
Wishes
Tao,
I don’t use R Studio, so I can’t say, but I suggest that you try. If you get a result that is good news.
Charles
Hi Dr.
Many thanks for this great page & tools.
I have 3 questions:
1. I’m confused on how to determine dummy variables. For your example, rows is Fertilizer. So i determined t1 (Blend X), t2 (Blend Y), t3 (Corn), t4 (Soy), t5 (Rice).
To compute SSrows: It’s regression between Y (values) and t1, t2, t1*t3, t1*t4, t1*t5, t2*t3, t2*t4, t2*t5. But using yours tools it’s inverted. Where is the problem.
3. What is the difference between Split Plot & Two Factor ANOVA with replications? Is is the same methodology?
3. Did you developped page of Principal Component Analysis (PCA)?
Thanks,
Abdelkader,
1) Sorry, but I don’t understand why you say it is inverted.
2) Two-factor ANOVA with replications and Split-plot ANOVA are not the same
3) Sorry, but I don’t understand your question
Charles
Thanks Dr.
Question 1 is solved, i was confusing dummy variables.
Question 2: please inform link of split plot ANOVA page.
Question 3: need step by step to do a principal component analysis (PCA).
Thank you,
2) I don’t understand your question.
3) See the following webpage:
Principal Component Analysis
Charles
Hello there,
Thank you for the page.
I’m wondering if I’ve got this right.
For 10 minutes I observed randomly chosen snorkellers and noted their rate of contact with the reef according to whether they came with a boat that had a tour guide or not.
At the same time I noted how far each observed snorkeller was from the guide (5m) throughout the observation period and if they swam alone or in a group.
Because of the nature of tourism at the study site, there is unequal numbers of people in each of the groups (ie people who stayed near the guide; people who stayed far from the guide; people who had no guide; and group size (1,2,3 etc)).
If I sqrt the counts, to investigate guide and group size can I use 2way ANOVA with regression?
Thank you.
Wayne,
You can use 2-way ANOVA using regression, but whether or not this is the correct test to use depends on what you are trying to test. Also, why do you want to take the square root of the counts?
Charles
Hi. Thank you for this post.
I would like to figure out if this is the approach i need to take.
here is my situation.
I have two groups of students (X and Y)
A survey was given at 2 time points (Pre and Post)
The survey has 4 categories of questions (1-4).
some students did not due both surveys.
the X and Y groups do not have equal numbers of students.
After removing the students who only did one survey, I think the proper analysis would be a repeated-measures 2-way unbalanced ANOVA (one analysis for each category of questions seems ok — rather than a 3-way ANOVA?)
does doing the regression like this work when (1) only pre/post is a repeated measure and (2) the X and Y groups are unbalanced?
Adam,
I don’t believe that the version of repeated measures ANOVA that is described on the website or supported by the Real Statistics software will work in this case. I plan to add a new version that will handle unbalanced models.
Charles
thank you charles for the quick response. Am I right in thinking that that is what I need?
I do have access to other software like matlab that can do regression. I just don’t know how to set it up. Can you hint as to what would be necessary?
Adam,
This would depend on the software that you use. I don’t use matlab, and so can’t help you with that.
Charles
Hi Charles,
thank you for the input. I have a related question.
is it possible to turn by unbalanced ANOVA into a balanced one, and then use Real Statistics to do a 2-way mixed (one factor is a repeated measure but the other is not) balanced ANOVA?
one of my groups has 50 samples and the other has 20. I was thinking of taking a random sample of 20 from the larger group to equalize the sizes before analysis. But i wonder if i would need to repeat that procedure 1000 times or something and then if the stats are significant (or not) 95% of the time then it would be ok. Does that make sense or is it totally unkosher?
Adam,
You can use this approach. The main drawback is that you will lose power because of the reduced sample size.
Charles
Hello Charles,
Is it possible to use this method in this case? I have 4 groups and each group contains very different number of samples, one has 32, 19, 28 and the last group contains only 1 sample. This seemed hopeless, but hope you can help. =) Thanks.
This method works with groups that have different numbers of samples, but not when one sample has only one element.
Charles
Oh I see. Thank you Charles.
But are there other possible statistical methods applicable for this case? =(
The only thing I can think of is to drop the group with only one sample or to combine it with another group.
Charles
If the degrees of freedom is 99 for columns and inter in Figure 9 type of data, it cannot calculate the SS or F or any P-value. Is there any limit for df? How to deal with that? Thanks.
I don’t know of any such limit, but if you send me an Excel file with your data and calculations I will try to figure out what is going on. You can find my email address at:
Contact Us
Charles
Could you explain why it is better philosophically to use regression (which is essentially an unweighted means approach) than to use sub-sampling to achieve equal n or simply to run ANOVA? What are the implications?
Sandy,
In any case ANOVA (with or without equal samples) is really a type of regression. If you can achieve a balanced model then by all means run the classical ANOVA model (the regression approach will yield the same results as the ANOVA approach).
Charles
among the different types of anova, which ones cannot be handled by multiple linear regression?
All the forms of ANOVA that I am familiar with can be handled by multiple linear regression or some other form of the regression.
Charles
Could you please explain how to estimate the standard error of the coefficients given in Figure 3. Thank you in advance.
Hi,
I believe I am following all of your directions correctly, but I keep getting the following message: “input in standard form cannot contain an empty cell.”
Thanks,
Rachel
Rachel,
If your input data is in the format of range A4:D14 of Figure 8 (part 1), then choose the Excel format and Regression options. Your input may have some empty cells but you shouldn’t get an error message.
If your input data is in the format of range F3:H29 of Figure 8 (part 1), then choose the Standard format and Regression options. Your data cannot have any empty cells or you will receive an error message.
If you are doing either of these correctly and are still getting the error message, then something else has gone wrong. In this case, if you send me an Excel file with your data I will try to figure out what has gone wrong.
Charles
Oh, I see. I was choosing standard format when I should have been choosing excel. Now I get the following message: “number of rows per sample must divide number of rows in input range evenly.” Your example has an even number of rows across conditions, whereas I have 36 in one and 51 in the other. Is it still possible to use Excel to analyze these data?
Thanks again for your help,
Rachel
Rachel,
I believe that all you need to do is make the number of rows per group the same. Since the model is unbalanced you just need to fill the smaller group with empty cells.
Charles
That worked. Thanks!
Hi Charles
I had the same issue, I think this instruction needs to be corrected:
…enter A4:D14 in the Input Range, click on Column/row headings included with data, select Standard format..(change to select Excel format)
Tom,
Thanks for catching this mistake. I have now changed the format to Excel format on the webpage.
I appreciate your help in improving the website. Thanks again.
Charles
Hi Charles,
After using the unbalanced two-factor ANOVA, is it possible to run a post-hoc test to determine between which factors there are significant differences? I have two independent variables, one with two levels and the other with three and one dependent variable.
As Tukey’s HSD requires equal group sizes, which test would you recommend? I have read that the Scheffe procedure allows different group sizes but is very conservative. Is it at all possible to carry this out using Excel?
Thanks for this page, it has been very helpful.
Hi,
A good choice in this case may be to use the Games-Howell test. See the webpage https://real-statistics.com/one-way-analysis-of-variance-anova/unplanned-comparisons/ for this and other choices. This test is included in the Real Statistics Resource Pack for use in Excel.
Charles
Hello Charles,
My experiment is – we have asked set of questions to 4 different org- 1) with leadership A &B 2) With leadership A & not B 3) with leadership B & not A 4) no A and no B
The questions answered on likert scale of 1-5. I am planning to use ANOVA with regression to see how the answers to question differ based on type of leadership. the sample sizes are unequal. My questions- 1.using ANOVA with regression is correct?
2. category with no leadership represents the intercept or should it be considered as seperate group
In general, you should be able to use regression to perform the ANOVA. I need to better understand the 4 org and your data better to answer your specific questions. E.g. are the samples for the 4 different orgs independent? Please provide more details.
Charles
The samples for different org are independent. the sample sizes for each type is-
with leadership A &B – 67
With leadership A & not B -4
3) with leadership B & not A – 94
4) no A and no B- 45
If the four samples are independent then each of the four would be a separate group.
Charles
Dear Sir Charles,
In a obove example 1, if the rows of blend X and rows of Blend Y is not same then how to run ANOVA and how to find interaction expecting your valuable feedback and guidance please.
The row counts don’t need to be the same to run ANOVA. You need to use the Regression option when using the Real Statistics data analysis tool.
Charles