Introduction
There are some problems where based on theoretical grounds we expect that the appropriate model is multiple regression without a constant term, i.e.
![]()
which is the usual multiple regression model where β0 = 0. In the case with just one independent variable, this is equivalent to finding the line through the origin which best fits the data.
On this webpage, we explain the theory of this model. See Regression w/o Constant in Excel for a description of various Excel and Real Statistics capabilities for such models.
Properties
For the sample {y1, y2, …, yn} of size n for the dependent variable y and samples {x1j, x2j, …, xnj} for each of the independent variables xj for j = 1, …, k, we let Y be the n × 1 column vector with the entries y1, …, yn and X be the n × k matrix [xij].
Most of the properties for ordinary multiple regression still hold where the design matrix is replaced by the matrix X = [xij], i.e. we don’t add columns consisting of ones. In particular, the regression coefficients for the least-squares model can be expressed by
![]() It also turns out that B = [bj] is the k × 1 column vector such that
It also turns out that B = [bj] is the k × 1 column vector such that
![]()
We can use the Y-hat k × 1 column vector with entries
![]()
to express the least-squares model as
![]()
where H is the n × n hat matrix
![]()
For ordinary multiple regression (including an intercept), we have
As we see in Multiple Regression in Excel, SST = SSReg + SSRes. To see this, first, note that
![]()
Next, we take the sum of both sides of the equation over all values of i. Finally, we square both sides and obtain
![]()
The desired result follows since
![]()
which follows by substituting β0 + β1x1 + … + βkxk for ŷi and simplifying.
These results don’t hold in the case where there is no constant term in the regression equation. Instead of fitting a line through the mean values, we need to instead fit the line through the origin. Since
![]()
It follows that
![]()
But![]()
![]()
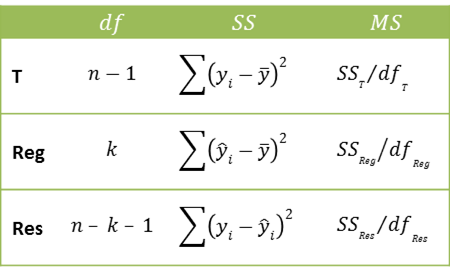
Thus, for regression without a constant term, we still have SST = SSReg + SSRes and dfT = dfReg + dfRes where

R-square
Using these new definitions, we define
![]() Another version of R2 is
Another version of R2 is
![]()
For multiple regression including the constant term, these definitions are equivalent. This is not necessarily the case when the intercept is not included in the model. It is also not necessarily the case that the sum of the squared errors is zero (as for regression that includes a constant).
The adjusted version of R2 is
![]()
It is important to note that the R2 value for regression with an intercept is not comparable with the R2 value for regression without an intercept (i.e. with an intercept whose value is zero). Thus if R2 = .95 for regression without an intercept and R2 = .80 for regression with an intercept, it doesn’t follow that the model without an intercept is a better fit for the data.
Caution
In general, it is better not to assume that the intercept is zero. In fact, as mentioned earlier, the only time you should use this type of model is when on theoretical grounds you expect that the intercept is zero. Some examples of this are:
- Hubble model for the expansion of the universe: galaxy speed = β ∙ distance from the earth
- Examples from Finance such as Capital asset pricing model (CAPM) and Cobb-Douglas production function
In the Hubble model example, there is no constant term since at time zero, according to the Big Bang Theory, all the matter in the universe is concentrated at a single point in space.
Of course, you can always use a regression model that includes the constant term, and check whether this term is significantly different from zero.
Excel and Real Statistics Support
See Regression w/o Constant in Excel for a description of various Excel and Real Statistics functions and data analysis tools for creating multiple regression models without an intercept.
References
Eisenhauer, J. G. (2003) Regression through the origin. Teaching Statistics. Volume 25, Number 3.
http://web.ist.utl.pt/~ist11038/compute/errtheory/,regression/regrthroughorigin.pdf
Kozak, A,, Kozak, R. A. (1995) Notes on regression through the origin
https://www.academia.edu/60996966/Notes_on_regression_through_the_origin
I followed you formula, but the calculation result is different compared with R?
Is there any wrong with the foruma: b(subj) above?
which is different from B=rev(x’x) x’ y??
Hello Minhu Chen,
What is rev() ?
I understand that the formula is different, but is the calculated value the same?
Charles
Do you know which formula uses Excel to compute the adjusted R^2 in a multiple regression without constant term? I have tried your formula, but the result is different.
Hello Hector,
I don’t know how Excel calculates the adjusted R-square in this case. It seems that the value is lower than I have seen from other software tools.
Charles
Hello, Charles
Excuse me,
How to make a chart in multiple regression ?
Ujang,
It depends on what sort of chart you are referring to, since many are possible. If you want a scatter plot of each independent variable against the dependent variable see
Scatter Plot
Keep in mind that if you have k independent variables you will need to plot each separately since charts tend to be two-dimensional and not k+1 dimensional.
Charles