Basic Concepts
The R-square statistic is not really a good measure of the ability of a regression model at forecasting. One approach to addressing this issue is to use only a part of the available data (called the training data) to create the regression model and then check the accuracy of the forecasts obtained on the remaining data (called the test data), for example by looking at the MSE statistic.
When there is limited data, a version of this approach, called leave-one-out cross-validation (LOOCV), is performed as follows where y1, y2, …, yn are the sample values of the dependent variable and X1, …, Xn are the k-tuple sample values of the independent variables.
For each i, create a regression model based on all the Xk and yk values leaving out Xi and yi, and then calculate the forecasted value of yi based on this model. Next, calculate the residual
![]()
Finally, calculate the cross-validation error as
![]()
Minimizing CV can be used for selecting a suitable model (e.g. by selecting the variables to retain in the model). Note that minimizing CV is asymptotically equivalent to minimizing the AIC (even for nonlinear models).
For multiple linear regression models, we actually don’t need to calculate the residuals for n regression models since it turns out that
![]()
where the ri are the residuals for the full regression model using all the data and the hi are the diagonal elements of the hat matrix (see Least Squares using Matrices).
A related statistic is the predictive R2, which is defined as
![]()
where the predicted residual error sum of squares (PRESS) is equal to nCV.
The Predictive R-square is a better measure of the predictive power of a regression model than R-square.
Example
Example 1: Calculate the value of CV, PRESS and Predictive R-square for the regression model in Example 1 of Multiple Regression Analysis in Excel (the data is redisplayed in range O3:Q14 of Figure 1).
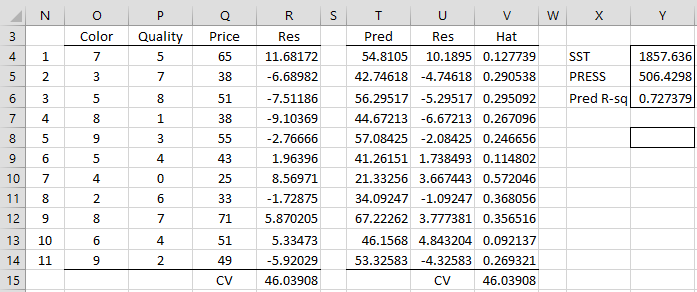
Figure 1 – CV, PRESS and Predictive R-square
The residuals for the regression models with one data element removed are shown in column R. E.g. the residual when Color = 7 and Quality = 5 for the regression model with X values in range O5:P14 and Y values in range Q5:Q15 is 11.68172 (cell R4), as calculated by the array formula
=Q4-TREND(DELROW($Q$4:$Q$14,N4), DELROW($O$4:$P$14,N4),O4:P4)
The other values in column R can be calculated by highlighting the range R4:R14 and pressing Ctrl-D. CV can then be calculated by the formula =AVERAGE(R4:R14^2), as shown in cell R15.
Alternatively, we can calculate CV as shown in cell V15 based on the regression of the data in O4:Q14. This is accomplished using the array formula =TREND(Q4:Q14,O4:P14) in range T4:T14, the array formula =Q4:Q14-T4:T14 in range U4:U14 and the array formula =DIAGHAT(O4:P14) in range V4:V14. CV is then calculated by the array formula =AVERAGE((U4:U14/(1-V4:V14))^2) in cell V15.
PRESS is 506.4 (cell Y5) as calculated by =R15*N14, SST is 1857.6 (cell Y5) as calculated by =DEVSQ(Q4:Q14). The predictive R-square is therefore 72.3% (cell Y6) as calculated by the formula =1-Y5/Y4. Note that the Predictive R-square value of 72.3% is lower than the R-square value of 85.1%.
Worksheet Functions
Real Statistics Functions: The Real Statistics Resource Pack provides the following functions.
RegCV(R1, R2, con) – CV for multiple linear regression based on the X data in R1 and Y data in R2.
PRESS(R1, R2, con) – PRESS for multiple linear regression based on the X data in R1 and Y data in R2
PredRSquare(R1, R2, con) – predicted R2 value for multiple linear regression based on the X data in R1 and Y data in R2
If con = TRUE (default) then a constant term is used in the regression.
For Example 1, we can use =RegCV(O4:P14, Q4:Q14) to calculate the CV value in cell R15 or V15 of Figure 1. Similarly, we can use =PRESS(O4:P14, Q4:Q14) to calculate the PRESS value in cell Y5 and =PredRSquare(O4:P14, Q4:Q14) to calculate the Predictive R-square value in cell Y6.
Examples Workbook
Click here to download the Excel workbook with the examples described on this webpage.
References
Hyndman, R. J. (2010) Why every statistician should know about cross-validation
https://robjhyndman.com/hyndsight/crossvalidation/#:~:text=Cross%2Dvalidation%20is%20primarily%20a,necessarily%20mean%20a%20good%20model.
Wikipedia (2019) Cross-validation (statistics)
https://en.wikipedia.org/wiki/Cross-validation_(statistics)#:~:text=Cross%2Dvalidation%20is%20a%20resampling,model%20will%20perform%20in%20practice.
Wikipedia (2019) PRESS statistic
https://en.wikipedia.org/wiki/PRESS_statistic#:~:text=In%20statistics%2C%20the%20predicted%20residual,used%20to%20estimate%20the%20model.
Hi Charles,
can I do a LOOCV with a complex, non linear regression models, i.e. polynomial?
Thank you.
Felix
Yes, Felix, a LOOCV can be used in such situations.
Charles
Charles,
do I have to change ‘con’ to FALSE in the worksheet funcions? And if so, I how do I enter my polynomials?
Thank you.
Felix
Felix,
Yes, you use False as the last argument in the function.
What polynomials are you referring to?
Charles
From another application I obtained a multivariate polynomial regression formula for which I want to calculate the CV instead of the multiple regression.
Hi Felix,
Thanks for the response, but I wouldn’t know what polynomial to use. This probably depends on the domain context, not on the statistical analysis.
Charles
Charles
Have you developed any cross validation models for time series data?
Hello Mark,
No, I haven’t. What do you have in mind?
Charles
Charles
R. Hyndman in his e-book, Forecasting: Princioles and Practice mentions evaluation on a rolling forecasting origin in chapter 5.10. Further discussion on the topic is at chapter 7.5.
Mark
Thanks, Mark.
I will look into this.
Charles
Hi Charles,
I find that PredRSquare equals neither R2 nor Adj-R2 generated by Excel default regression.
May I know the difference? Thus, should I interpret it as R2 or Adj-R2?
Thank you for your great effort! What a great tool!
Thx
Jack
Hi Jack,
Glad that you like the Real Statistics tool.
Yes, you are correct that PredRSquare is not equal to R2 nor Adj-R2 generated by Excel.
R-square is a measure of the fit of the data to the regression model. The concern is that the model overfits the data used to create the model. A high value of R2 doesn’t necessarily mean that the model will do a good job predicting the y-value for new X data. PredRSquare (and other CV metrics) is viewed as doing a better job of measuring how good the model is at predicting the y-value for X data that was not used to build the regression model. A better way of measuring the predictive capability of a regression model is to build the model with part of the available data and then test the accuracy of the model on the rest of the data. The problem with this approach is that you may not have a lot of available data and so would prefer to use all the data to build the model. But this leaves no data to test the model. CV, including PredRSquare, is a compromise, whereby you use all the data to build the model, but measure the predictive accuracy using the same data but in a slightly different way.
Charles
Dear Charles,
can you please add the LOOCV regression to the Real Statistics Data Analysis Tools? Editing the arrays and formulas everytime to test different sets of variables and datasets is cumbersome. Anyway, it is a great tool.
Thank you.
Felix
Hello Felix,
Glad that you like the tool.
LOOCV regression is actually n different regressions where n is the number of rows of data. Each regression is based on all the rows of data leaving out one row. The key reason for doing this is to calculate CV, PRESS, and Predictive R-square, which the Real Statistics software already provides worksheet functions for.
What exactly do you want me to add to the software?
Charles
Hello Charles,
thank you for the reply. I am sorry, but I missed the worksheet function the first time. Now it is very convenient.
A further point. I want to calculate the MAE to compare with the RMSE (root from CV). I can do this from the residuals, but is there also a worksheet function for the MAE? Am I correct?
Thank you. Best.
Felix
Charles,
please let me add the following question.
Should not a low CV be concordant with a high PredRSquare? However, I have two simliar predictions that have CV and PredRSquare in the same direction. I wonder which one has the better model.
I would appreciate if you could comment. Thank you.
Felix
Felix,
Are you saying that a high CV correlates with a high PredRSquare or the opposite?
Charles
Yes,
i,e. CV 0.024 and PredRSq 0.83 in one prediction and CV 0.018 and PredRSq 0.78 in the other. I cannot wrap my head around how this works mathematically and what it means.
Felix
Felix,
CV and PredRSquare are different types of measures, and so I don’t think you can easily compare them. As you can see from Figure 1, PredRSquare is more like RSquare, namely it takes a value between 0 and 1, while CV can take a much wider range of values.
Charles
Hi Charles
Apologies for the simple question. Where/how do you find these LOOCV methods in your program? I cant see them under any of the obvious tabs/submenus. If I try just using the function you provide alone eg ‘=RegCV(input cells,input cells,con)’ I get an error message !VALUE!.
Many thanks
David
Dear Charles,
Another question please. Are there real statistics functions that can be used to do k-fold cross-validation? Also any real statistics functions for Bayesian Information Criterion (BIC) for selecting (comparing) good models? Of course, AIC is equally good!
Dear Jonathan,
1. Real Statistics does not yet support k-fold cross-validation, except for Ridge Regression.
2. BIC (aka SBC) and AIC are supported throughout the Real Statistics software. E.g. RegAIC, RegAICc, RegSBC.
Charles
Do you have plans to implement k-fold cross-validation as a whole in the future?
Hello Rafael,
Yes, I expect to add this in the future, although I don’t have a specific date.
Charles
Dear Charles,
Great job! We really appreciate your work and the assistance given.
Please allow me to ask whether the PredRSquare(R1, R2, con) is the
same as adjusted R**2. Thanks.
No, Jonathan, it is not the same.
Charles