In Comparing the Slopes for Two Independent Samples, we show how to test whether the slopes of two independent samples are significantly different. We now show how to extend this test to intercepts as well as slopes, and to more than two independent samples. We start by showing another approach to solving Example 1 of Comparing the Slopes for Two Independent Samples.
Example
Example 1: In Figure 1, we show two samples, each comparing life expectancy vs. smoking. The first sample is for males and the second for females. Determine whether there is any significant difference in the slopes for these two populations. If there is no significant difference in the slopes, determine whether there is a significant difference in the intercepts.
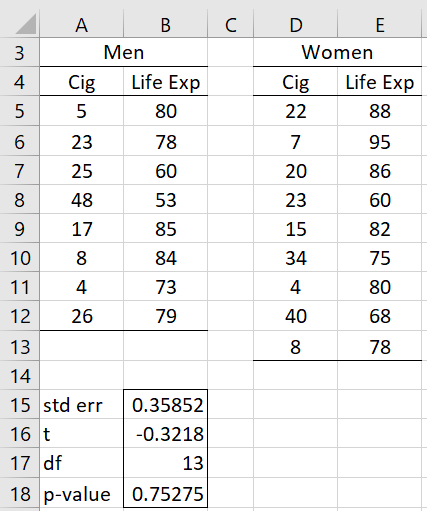
Figure 1 – Slopes test for independent samples
Using the formula =SlopesTest(A5:A12,B5:B12,D5:D13,E5:E13,,TRUE) in range A15:B18, we see that there is no significant difference between the two slopes (p-value = .75 > .05 = alpha).
Alternative Approach
In Figure 2, we show another approach to achieving this result.
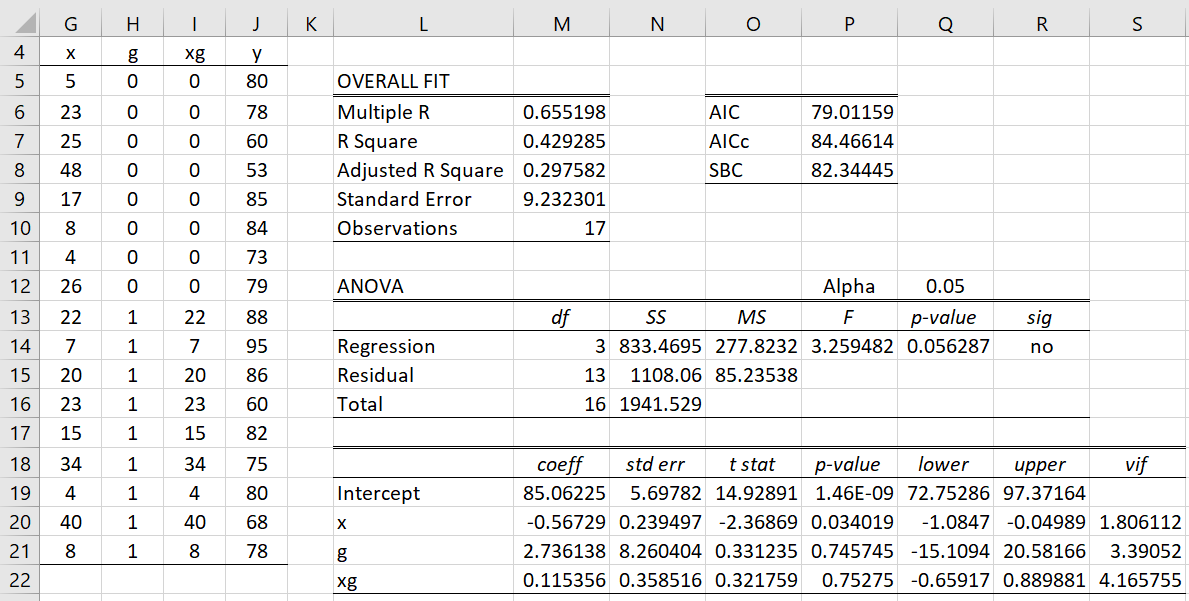
Figure 2 – Slope Test using regression
We combine the two samples in Figure 1 into one sample using the dummy variable g (for gender) where g = 0 for male samples and g = 1 for female samples. We also use the interaction xg of x and g as an independent variable. The reformatted data is shown in range G4:J21.
We now look at the regression model
y = b0 + b1x + b2g + b3xg
as shown on the right side of Figure 2.
For males, g = 0 and so the regression model becomes y = b0 + b1x with slope b1. For females, g = 1 and so the regression model becomes y = (b0 + b2) + (b1 + b3)x with slope b1 + b3. Thus, the null hypothesis that the two slopes are equal is equivalent to b3 = 0. From cell P22, we see that the p-value for this coefficient is .75275, which supports the null hypothesis that the two slopes are not significantly different.
Comparing Intercepts
We now turn our attention to the intercepts. We see from the above that the intercept for males is b0, while for females it is b0 + b2. Since the p-value for b2 is .745745 (cell P21), we also conclude that there is no significant difference between the intercepts.
When there are more than two samples
We can use the same approach even when there are more than two samples. For example, with three samples S0, S1 and S2, we use two dummy variables d1 = 1 if the data comes from sample S1 and d1 = 0 otherwise and d2 = 1 if the data comes from sample S2 and d2 = 0 otherwise.
The regression model takes the form
y = b0 + b1x + b2d1 + b3d2 + b4d1x+ b5d2x
or equivalently
y = (b0 + b2d1 + b3d2) + (b1 + b4d1+ b5d2)x
For the data in sample S0 (where d1 = d2 = 0), the slope is b1 and the intercept is b0.
For the data in sample S1 (where d1 = 1 and d2 = 0), the slope is b1 + b4 and the intercept is b0 + b2.
Finally, for the data in sample S2 (where d1 = 0 and d2 = 1), the slope is b1 + b5 and the intercept is b0 + b3.
Thus, samples S0 and S1 have the same slope if b4 = 0. Samples S1 and S2 have the same slope if b4 = b5. samples S0 and S2 have the same slope if b5 = 0. All three have the same slope if b4 = b5 = 0. A similar test follows for the intercepts.
Examples Workbook
Click here to download the Excel workbook with the examples described on this webpage.
References
Stack Exchange (2016) Ways of comparing linear regression intercepts and slopes
https://stats.stackexchange.com/questions/232040/ways-of-comparing-linear-regression-interepts-and-slopes
Graph Pad (2025) Comparing slopes and intercepts
https://www.graphpad.com/guides/prism/latest/curve-fitting/reg_comparingslopesandintercepts.htm
Zar, J. (1984) Biostatistical Analysis, 2nd edition, Prentice-Hall
Hi Charles,
When I click on the link to download the Excel workbook above I don’t see the template that appears in Figure 2. What statistical method should I select to use this template?
Thank you.
Hi Charles,
I don’t seem to be able to find the =slopestest function in my Excel (365 Version 2301). Do I need to download something to access it, like an Add-In?
Hi Georgia,
Yes, you need to download the Real Statistics add-in. It is free. You can download it from
https://real-statistics.com/free-download/real-statistics-resource-pack/
Charles
Hello Charles,
I want to analyze the slopes between two wheelchair tires (push forces over a 2×4 board at 5 different inflation pressures) I think using Example 1 format will work well for this purpose. Can you tell me the format for determining the degrees of freedom? Thanks for making this valuable resource available.
Hi Mike,
The regression will calculate the degrees of freedom for you automatically but in any case, df = n1+n2-4 where n1 and n2 are the sizes of the two samples.
Charles
Thank you for your response. I did an installation to have access to =SlopesTest function and set up my data like Example 1. After hitting “return” one cell below my data table has “std err” but nothing else. Not sure if my Mac version of Excel 15.33 (2017) is the problem. Thanks in advance!
Hi Mike,
No problem with your release of Excel. SlopesTest is an array function and so to get the full output you can’t simply press the Enter key. See the following webpage for how to use an array function.
Array Formulas and Functions
(Note that with Excel 365 pressing the Enter key is sufficient).
Charles
Hi Charles,
I seem to be facing a similar problem. Even though I’ve copied the very same numbers in Example 1 above, the formula just gives me an error for the output (#NAME?) Could you explain the best way to use this function?
Thanks,
Georgia
Hello Georgia,
You need to first download and install the Real Statistics software. It is a free Excel add-in. You can download it from
https://real-statistics.com/free-download/real-statistics-resource-pack/
This webpage also describes how to install it.
Once you have done this you can use the worksheet functions and data analysis tools described on the website.
Charles
Hi Charles,
I need to test the significant differences of two intercepts from linear regression. I wonder if the only available method is that one reported in figure 2.
In case, where can I find the data represented in figure 2? It seems they are not in any of the workbooks. Thank you.
Hi Alessandro,
Perhaps there are other methods, but this is the only method that I know of.
I couldn’t find the spreadsheet corresponding to this example either. I don’t know why it wasn’t included (or perhaps it was included but I can’t remember where).
In any case, I expect to issue a new release of the Real Statistics software in a couple of days. I will include this example in Regression 1 examples workbook.
Charles
Thank you.
Another question, if you don’t mind. Is there a way to calculate the significant differences between the x-intercepts of two linear regressions? I read that a t-test could be applied, but is there somthing about it in your spreadheets. Thank you again.
Hi Charles,
I’m still unable to find the spreadsheet corresponding to figure 2 that Alessandro refers to above. Has that example now been included in Real Statistics? If so, how do I find it?
Thank you.
Brian,
Thanks for bringing this to my attention. I see that the link to the workbook is for the wrong workbook.
I have just corrected the problem. Hopefully, you can now access the correct workbook by clicking on the link.
Charles