Moderation Analysis is used to determine how much the relationship between the independent (X) and dependent (Y) variables changes based on the addition of a moderating (M) variable.
The analysis is performed using linear regression using X, M, and X*M as independent variables and Y as the dependent variables. This analysis makes sense when there is a significant correlation between X and Y, but there isn’t a significant correlation between M and Y.
Before carrying out the regression, we first center the X and M (or optionally standardize these variables). This makes the interpretation easier and reduces multicollinearity.
Example
Example 1: Determine whether Age (M) has a moderating effect on the relationship between Dexterity (X) and Efficiency (Y) for operators in a chemical plant based on the data displayed on the left side of Figure 1.
The right side of the figure contains the centered data along with the interaction X*M. Here, range E4:E23 contains the array formula =A4:A23-AVERAGE(A4:A23) and F4:F23 contains =C4:C23-AVERAGE(C4:C23). Cell G4 contains the formula =E4*F4 and cell H4 contains =B4, and similarly for the other cells in columns G and H.
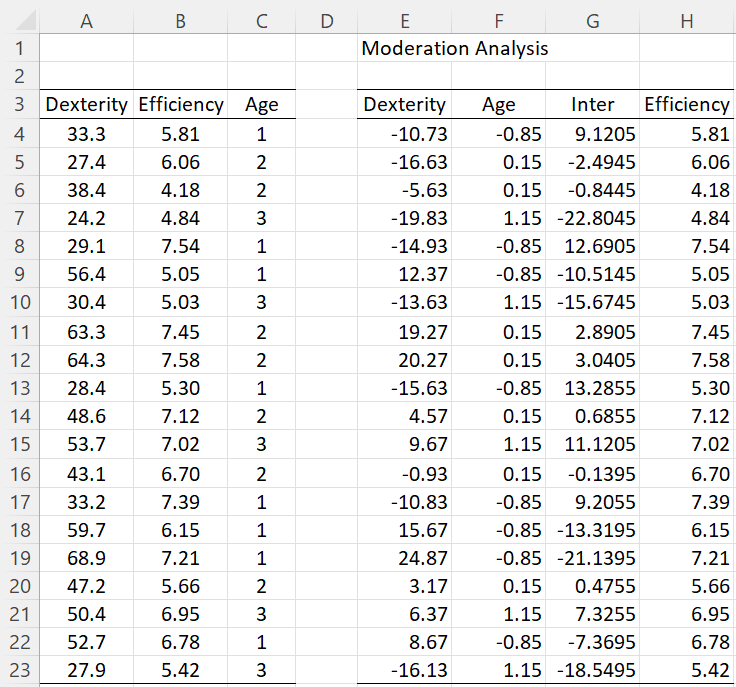
Figure 1 – Raw and centered data
Correlations
It appears from Figure 2 that Dexterity (X) and Efficiency (Y) are correlated, while Age (M) and Efficiency (Y) are not correlated. Here, we placed the array formula =CORR(F4:H23) in range K4:N7.
In fact, if you ran the Correlation Test data analysis tool, you would see that the first correlation is significantly different from zero (p-value = .03), while the second is not significantly different from zero (p-value = .40). You will see similar results from the regression shown in Figure 3.
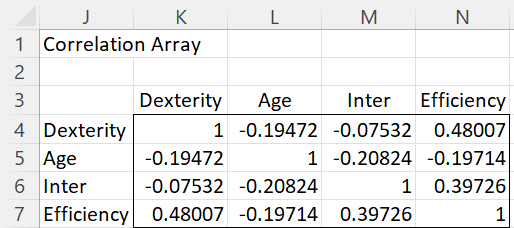
Figure 2 – Correlations between the variables
Regression
We now use the Regression data analysis tool using Dexterity, Age, and the Interaction between Dexterity and Age as the independent variables and Efficiency as the dependent variable. The result is shown in Figure 3.

Figure 3 – Regression analysis
We see from Figure 3 that the Interaction is significant (p-value = .04 in cell T20), which shows that Age has a moderating effect on the relationship between Dexterity and Efficiency. We see this more clearly in the Level Analysis shown in Figure 4.
Level Analysis
This figure displays the predicted values for Efficiency (Y) using the usual formula
![]()
For values of Dexterity (X) at -1, 0, 1 standard deviations from the mean (which is now centered on zero) and -values of Age (M) at -1, 0, 1 standard deviations from its mean.
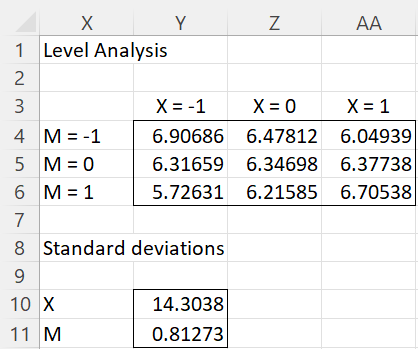
Figure 4 – Level analysis
Here, cell Y10 contains the standard deviation for X using the formula =STDEV.S(E4:E23), and Y11 contains the standard deviation for M using the formula =STDEV.S(F4:F23).
E.g. cell Y6 (where X = -1, i.e. one standard deviation below the mean, and M = 1, i.e. one standard deviation above its mean) contains the formula
![]()
using the worksheet formula =Q17-Q18*Y11+Q19*Y10-Q20*Y10*Y11.
Level Analysis Chart
The relationship is easier to see graphically, as shown in Figure 5.

Figure 5 – Level analysis chart
To create this chart, highlight range X4:AA6 and select Insert > Charts|Line Chart. After some fine-tuning, the result shown in Figure 5 appears.
X = -1 represents a low level of Dexterity, X = 0 represents a mean level of Dexterity and X = 1 represents a high level of Dexterity. M = -1, 0, 1 can be interpreted in a similar manner for Age (younger, mean, older). We see from the blue line in Figure 5 that for younger workers, perhaps counter-intuitively, higher levels of Dexterity result in lower Efficiency. For the mean-aged workers (the red line), higher levels of Dexterity result in slightly higher levels of Efficiency; while for older workers (grey line), higher levels of Dexterity result in higher levels of Efficiency.
Data Analysis Tool
Real Statistics Data Analysis Tool: To perform the analysis for Example 1 using the Real Statistics Resource Pack, you can press Ctrl-m and select the Moderation Analysis option (from the Reg tab when using the multi-page user interface). Next, fill in the dialog box as shown in Figure 6.
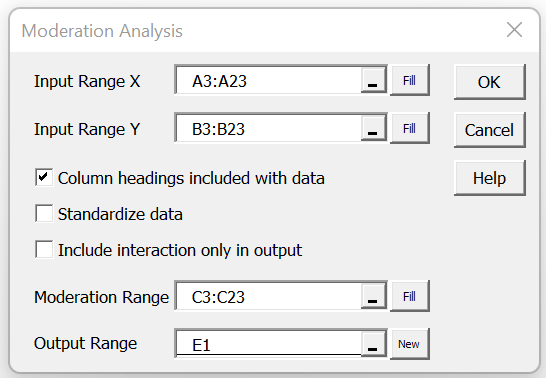
Figure 6 – Moderation Analysis dialog box
When you click on the OK button, the output shown in Figures 1, 2, 3, 4, and 5 appear.
If you check the Standardize data option then the X and M input data will be standardized instead of centered. In this case, the standard deviations shown in Figure 4 won’t be displayed since they are both one.
You can optionally insert A3:B23 in the Input Range X field and leave the Input Range Y field empty to obtain the same result.
If you check the Include interaction only in output, then the independent variables for the regression will be the moderating variable (M) and the interaction, and not X. This is similar to the approach used by SPSS. In this case, the Level Analysis will not be included in the output.
Examples Workbook
Click here to download the Excel workbook with the examples described on this webpage.
References
Howell, D. C. (2010) Statistical methods for psychology (7th ed.). Wadsworth, Cengage Learning.
https://labs.la.utexas.edu/gilden/files/2016/05/Statistics-Text.pdf
Wuensch, K. (2016) Continuous Moderator Variables in Multiple Regression Analysis
https://www.studocu.com/en-us/document/east-carolina-university/psychological-statistics/continuous-moderator-variables-in-multiple-regression-analysis/1068430
Memon, M. A., Cheah, J-H, Ramayah, T., Ting, H., Chuah, F. Cham, T. H. (2019) Moderation analysis: issues and guidelines. Journal of Applied Structural Equation Modeling
https://jasemjournal.com/wp-content/uploads/2019/10/2019-Memon-et-al-Moderation.pdf
Cucos, L. (2022) How To Perform Moderation Analysis in SPSS [2 Methods]. Uedufy
No longer available online
Edwards, J. R. (2008) Seven deadly myths of testing moderation in organizational research
https://psycnet.apa.org/record/2008-09949-006
How I can find the Moderation analysis tool? its not found in reg list.
Hello Mohammad,
If you have the Real Statistics add-in installed, you should find Moderation Analysis towards the bottom of the Reg tab (after pressing Ctrl-m)
Charles
Hi Charles,
Several papers I’ve read call for the reliability of the product term (X*M) and of the individual terms (X and M) to be measured and reported in moderation analyses. There’s a link to one such paper below.
http://public.kenan-flagler.unc.edu/faculty/edwardsj/Edwards2008b.pdf
I’ve seen that the section on reliability testing on the XRealStats site is mainly for questionnaire data and I’m not sure any of the tests are suitable for my data which is not questionnaire related but rather indices for economic policy (X) in different countries and summary measures for values/beliefs (M).
Can you possibly suggest a method for obtaining a reliability estimate for such variables?
Thank you!
Gareth
Hello Gareth,
Thanks for sharing the paper on moderation analysis. I have added a link to this paper.
The reliability tests on the website are not just for questionnaires. Can you explain in more detail the nature of your data and what sort of reliability testing you have in mind.
Charles
Hi Charles,
Thank you for your response.
In reference to equation 6.8, Edwards (2008: 149) says”ρXZ is the reliability of XZ and ρX and ρZ are the reliabilities of X and Z, respectively.”
I will measure the covariance from the regression data directly. What remains for the calculation of the interaction term reliability is measurements for ρX and ρZ.
My regression data (n=500) is continuous and the variables X and M range between 1 and 20 over different time periods. I’ve standardised the variables as (according to equation 6.8) that’s what’s required for the reliability measurement of the interaction term. I give an example below of the standardised data:
Country; Year; X (Policy); M (Beliefs)
A; 1980; -4.38; 1.31
A; 1981; -4.38; 1.31
A; 1985; -2.37; 0.92
A; 1985; -2.37; 0.92
A; 1990; -2.37; 0.92
B; 1980; -0.20; 1.50
B; 1981; -0.20; 1.50
B; 1985; 0.16; -0.01
B; 1985; 0.16; -0.01
B; 1990; 0.18; -0.01
…
Subsequently, I split the grouped data (all countries over all years) into two sets (odds and evens) and ran a Spearman/Guttman analysis on the X and M variables separately. Does that sound suitable for an internal consistency test? I’m getting reliability values of around 0.9 for both X and M.
Thank you!
Gareth
Hello Gareth,
From what I understand of your scenario, your approach seems reasonable, but I have not tried to explore this approach in detail.
Charles
Hello! I have problem with my research. Can you help me please? I want to do moderation analysis and my data are non parametric. Also they have outliers. Is this a problem and what can I do to fix it? Thank you!
Catherine,
What do you mean by the statement “my data are non parametric”?
The following link provides information about the assumptions for moderation analysis:
See https://usq.pressbooks.pub/statisticsforresearchstudents/chapter/moderation-assumptions/#:~:text=Moderation%20Assumptions&text=There%20should%20be%20a%20moderator,can%20check%20with%20a%20scatterplot.
Outliers are a complication in many analyses. You can’t simply delete the outliers (unless you know for sure that the measurements are all wrong), but outliers tend to distort any analysis. One approach is to perform the analysis with the outliers and repeat the analysis without the outliers, and then report both results.
Charles
Thank you very much!
Hello, I am not able to find Moderation Analysis in the Real statistics tool. Was it removed? Thanks!
Hello Hemal,
You can find it in the Reg tab.
Charles
Dear Charles, I am able to find mediation analysis, however, can not find Moderation analysis. I tried installing the latest version but still had no success. Unfortunately, I can not add the image to show my Reg tab to show, but genuinely, it is not showing up.
Best Regards,
Hemal