Real Statistics Data Analysis Tool: The Real Statistics Resource Pack provides the Correlation data analysis tool. This tool can be used to calculate Pearson’s, Spearman’s (rho), and Kendall’s (tau) correlation coefficients, as well as conduct various versions of a one-sample correlation test.
Pearson’s Example
Example 1: Repeat Example 1 of Correlation Testing via the t Test (testing Pearson’s correlation for the data in range A3:B18 of Figure 2) using the Correlation Tests data analysis tool.
To use this tool, press Ctrl-m and select Correlation Tests from the Corr tab. Fill in the dialog box that appears as shown in Figure 1 and press the OK button.
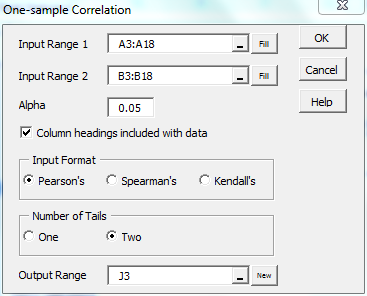
Figure 1 – Correlation data analysis tool dialog box
The output for the two-tailed test is shown on the right side of Figure 2 (starting at cell J3). The output contains Pearson’s, Spearman’s and Kendall’s correlation coefficients (cells K5, K6 and K7). In addition, both the two-tailed t-test and normal test using the Fisher transformation are displayed where the hypothetical population Pearson’s correlation is ρ = 0.
If you want to conduct a one-sample correlation test where ρ is equal to some value that is not zero, you would simply perform the same steps as described above and then change the value in cell N11 to this value. In this case, you need to ignore the results of the t-test since they would not be accurate.
You can also change the value for alpha and/or the number of tails, and the output values will change automatically.
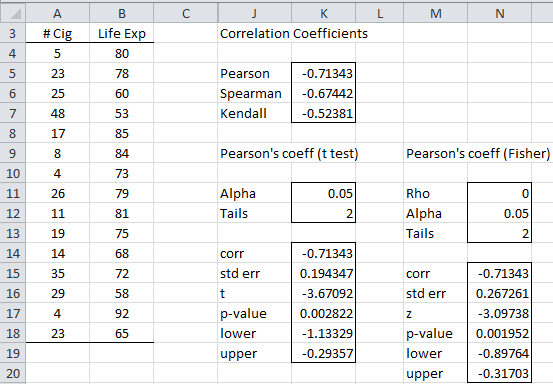
Figure 2 – Correlation data analysis (Pearson’s)
Spearman’s Example
Example 2: Repeat Example 3 of Spearman’s Correlation (testing Spearman’s correlation for the data in range A3:B18 of Figure 3) using the Correlation Tests data analysis tool.
Press Ctrl-m and select Correlation Tests as before, but when the dialog as in Figure 1 appears, select the Spearman’s option. The result is shown in Figure 3.
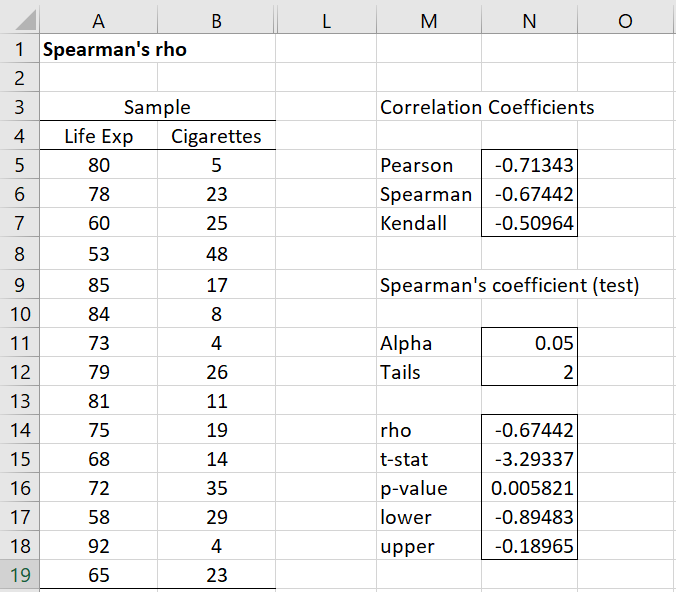
Figure 3 – Correlation data analysis (Spearman’s)
We see from the figure that Spearman’s rho is -.67442 (cell N14). Since p-value = .005821 < .05 = α, we are quite confident that rho is not zero. If you change the values in cells N11 and/or N12, the other values of rho, t-stat, and p-value will change automatically.
Kendall’s Tau Example
Example 3: Repeat Example 1 of Kendall’s Tau (testing Kendall’s correlation for the data in range A3:B18 of Figure 3) using the Correlation Tests data analysis tool.
Press Ctrl-m and select Correlation Tests as before, but when the dialog as in Figure 1 appears, select the Kendall’s option. The result is shown in Figure 4.
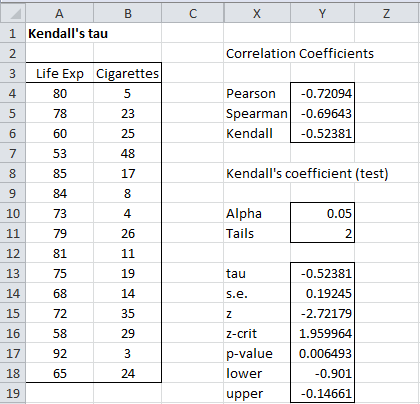
Figure 4 – Correlation data analysis (Kendall’s)
We see from the figure that Kendall’s tau is -.52381 (cell Y13) and that we are 95% confident that the actual value is in the interval (-.901, -.147). Since p-value = .006493, we are pretty confident that tau is not zero.
If you change the values in cells Y10 and/or Y11, the values of tau, standard error, etc. will change automatically.
Observation: The ties correction factor is used for the Kendall’s Tau option of the Correlation data analysis tool.
Links
Examples Workbook
Click here to download the Excel workbook with the examples described on this webpage.
References
Howell, D. C. (2010) Statistical methods for psychology, 7th Ed. Wadsworth. Cengage Learning
https://labs.la.utexas.edu/gilden/files/2016/05/Statistics-Text.pdf
Wikipedia (2012) Correlation coefficient
https://en.wikipedia.org/wiki/Correlation_coefficient
eGyanKosh (2017) Unit 2: other types of correlation
http://egyankosh.ac.in/bitstream/123456789/20956/1/Unit-2.pdf
Wikipedia (2015) Kendall rank correlation coefficient
https://en.wikipedia.org/wiki/Kendall_rank_correlation_coefficient
Dear Dr. Zaiontz,
Would it be appropriate to use correlation to check for trends in submerged aquatic vegetation change over time?
For example: average seagrass density in an area measured each year
(Year, Average Seagrass Density)
2002 2.12
2003 2.11
2004 3.2
2005 2.99
2006 2.78
2007 2.63
2008 2.34
2009 2.38
2010 2.84
2011 2.4
2012 2.43
2013 2.72
2014 2.62
2015 2.72
2016 2.95
2017 2.79
2018 2.81
2019 2.89
2020 2.9
2021 2.7
2022 2.91
If so would Pearsons or Kendalls tau-b be better? If I shouldn’t be using correlation here, should I be using a linear regression or a Mann-Kendall test instead?
I can’t use this data to forecast because it is Braun-Blanquet data and the goal is just to track if there are any changes over time not predict the future values. The hypothesis is there is no trend, the null would be that there is some trend.
Thank you for your time and your whole website it is very helpful.
Kate
Hi Kate,
There are several approaches to testing for a trend. Mann-Kendall is one of them. See
https://www.real-statistics.com/time-series-analysis/time-series-miscellaneous/mann-kendall-test/
Charles
Correlations
AVERAGE AVERAGE (Criterion Test)
AVERAGE Pearson Correlation 1 .789**
Sig. (2-tailed) .000
N 123 123
AVERAGE (Criterion Test) Pearson Correlation .789** 1
Sig. (2-tailed) .000
N 123 123
** Correlation is significant at the 0.01 level (2-tailed).
How will I interpret this in validity?
Hannah,
A correlation of .789 is quite high. A significance of .000 probably means that it is very unlikely that the real population correlation is zero (a significant result). Without more context, I can’t say much more.
Charles
Dear Charles,
whe do I need to use 1 Tail and when do I need to use 2 Tails in the spearman´s correlation?
Best regards
Hannah
Hello Hannah,
If you know for certain that only one of the tails is possible, then you can use the one-tailed test. Otherwise, you should use the two-tailed test. See https://www.real-statistics.com/hypothesis-testing/null-hypothesis/
Charles
how to calculate (std err – Upper – Lower), of Pearson Correlation and linear regression manually? step by step in excel
Table 4. Relationship between socio-economic characteristics of the respondents and their buying behavior
SOCIO-ECONOMIC CHARACTERISTICS COEFFICIENCT P-VALUE
Age
.301**
.002
Civil Status
.364**
.000
**. Correlation is significant at the
*. Correlation is significant
Table 5. Relationship between Islam culture and their buying behavior of the respondents
VARIABLES COEFFICIENCT P-VALUE
Islam culture and buying behavior
.775**
.000
**. Correlation is significant at the
*. Correlation is significant
dicuss for me
Hello,
What is your question?
Charles
Hi, i wana know that i wana check the correlation between the management and their practices…..I mean i have 20 practices as a example and i have 4 management parts and i wana check the correlation of those 20 practices comes under which domain of management out of those 4 parts.??
Sorry, but I don’t understand your question.
Charles
please dear sir, how to correct rainfall data from remote sensing or satellite data in excel sheet with ground station data, for example annual rainfall time series data record in ground station and same time get remote sensing data how to correct the remote sensing data according to ground station data
Salah,
Sorry, but I don’t understand your question. What do you mean by “correcting” the data?
Charles
sorry, i mean correction data, for example
time series rainfall data which is download from any remote sensing system should de corrected and calibration with ground station rainfall data, anyway you have two type of data, the first one it is original as ground record and the second type it is satellite data, i want correct time series data which is get it from satellite depending on ground station data
thanks dear sir
best regard
Salah,
I don’t know how the satellite data depends on the ground station data.
Charles
Please sir in a situation whereby one’s research topic consist of relationship between four Independent variables and one dependent variable can correlation design be used in such research?
What hypothesis are you trying to test?
Charles
Dear Dr. Zaiontz,
thank you very much for this versatile, efficient, easy to use and free add-on. I am still an amateur and the more I’m using it, the more I understand.
I am confused, though, by “upper and lower” values: what do they represent?
Here’s the example: I have determined a correlation between two columns of values, with
Spearman Index of -0,28
p value= 0,073
lower= -0,55
upper 0,023
How would you interpret this results?
Serge,
The upper and lower refer to the confidence interval for the parameter being estimated (Spearman’s rho in your case). Assuming alpha = .05, the a 95% confidence interval for rho of (.55,.023) would mean that if you repeated the sample experiment a large number of times, you would expect that the true value of rho would occur in this interval 95% of the time. This is a way of looking at the population (true) value of rho as an interval instead of as a single value. It does not mean that the probably that the population rho is in this interval is 95%.
Charles
Thank you very much
Dear Charles,
I have two data sets each consisting of 17 means±S.D.
How can I calculate coefficient of correlation in this case?
Many thanks,
Juozas
Juozas,
I don’t completely understand your question, but you can’t calculate the correlation coefficient from just the means and standard deviations.
Charles
can you mention the name of the tool used for co-relation process
One Sample Correlation. This is a Real Statistics data analysis tool. You won’t find it among the standard Excel data analysis tools.
Charles
Great article Charles. I am working with a series of non-random numbers (stock price changes on a given day). On 30 random days, I have the returns on 10 different stocks. I would like to find out of A, these companies are correlated with each other, and B, which of these companies are the most correlated with each other.
There is logical data behind why they should be correlated, but I’m not sure that part is relevant to the explanation here. Thank you
Ross,
Assuming that “companies” and “stocks” refer to the same thing, I understand that you have data that can be organized into the range A1:J30 as follows: Each column contains the data for one of the 10 stocks and each row contains the data for one of the 30 days.
You can now create a correlation matrix using the Real Statistics formula =CORR(A1:J30). This will show all the pairwise correlations. The values that are the highest are the most correlated.
Charles
Perfect, thank you
Hi,
I need to compare correlations of testscores from different test-results of the same Test/differents Tests (same construct) from same/different populations.
I think I need to to standardize the results via Fishers’ Z? Is there any tool her?
Manfred,
It is not clear to me what specifically you are looking for, but perhaps the following webpage can help
https://real-statistics.com/correlation/two-sample-hypothesis-testing-correlation/
Also there is the FISHER function which may be useful.
Charles
Hi Charles,
thanks for the answer: my problem: I have to tests (intelligence, dyslexia,… ) with correlations to school-grades. The correlations are somewhat different. I want to know whether the differences are significant, so that I can prefer one test. Samples, time of norming etc are different (ages, gender, schoolform are mostly similar)
thanks for your help.
Manfred
Manfred,
You say that you “want to know whether the differences are significant.” In order for me to be able to help you, please give me an example of what sort of differences you are referring to.
Charles
Hi Charles,
the differences of Correlations between different tests and school grades
Thanks,
kind regard manfred
Sorry Manfred, but I don’t understand your comment.
Charles
Hey Charles wonderful job. But here is one problem that correlation is of 2 types; phenotypic and genotypic. What about calculation of genotypic correlation?
From a statistical point of view there is only “correlation”. I am not a biologist or geneticist and so don’t have specific knowledge about how this term might be used in those fields.
Charles
Hi Charles,
I am into random numbers testing for online gambling. I need to perform below tests:-
1. Serial Correlation Test : The Serial Correlation Test determines whether or not the numbers picked for the current draw in any way determines subsequent plays. We calculate a correlation coefficient r based on pairs of data taken from the same number position on consecutive draws.
2. Interplay Correlation Test : This test determines whether or not there is any relation between two positions of numbers chosen within the same draw. It is essentially the same analysis that is performed in the Serial Correlation Test, but it is performed on pairs of data taken from different number positions within the same draw rather than between draws.
I had figured out approach for serial correlation test, but not sure about calculating correlation coefficient for second test. Can you please help ? Below the example of number drawn:-
A B C D E
3 1 3 0 2
0 2 4 1 1
2 2 4 3 1
2 2 1 1 0
2 1 1 0 1
2 0 3 1 2
3 2 1 1 2
1 1 5 0 2
Sheetal,
Sorry, but I am not familiar with the interplay correlation.
Charles
No problem, Charles!
Hi, Sir.
Can I use correlation test (Pearson’s) to check the correlation between two dependent/response variables? Here’s a background of the study: I have 3 factors with 2 levels each then there are about 5 response variables measured after the study but I am interested to know the correlation between the 2 only. I used anova (three fixed factors using realstats addin) to check the significance of the 3 factors. How would I know if this significance means positive or negative? Also, regarding the 2 response variables obtained from the study, can I use correlation test to check correlation between them?
Ming
Ming,
You can use a correlation test to test the correlation between two variables.
Anova tests whether there is a significant difference between two or more levels in a factor or various interactions. I don’t know what you mean by positive or negative significance. Significance is not directional; there is only significance.
Charles
So I can use correlation test between the 2 response variables measured, right? Thanks. “Anova tests whether there is a significant difference between two or more levels in a factor or various interactions.” – Only for the levels in a factor? Can I also conclude from Anova that a factor has a significant effect to the response measured if for example, I get a “yes” in the ‘sig column’ referring to ‘A’ factor in the Anova table. Can I also conclude that there is an interacting effect between two factors if I get a “yes” for ‘AxB’ for the response measured? By positive, I mean if I increase the magnitude of the factor (in case of my study it is metal concentration), the response measured (metal uptake in the study) also increases. In negative, if I decrease the factor, the response also decreases. Does any input in the anova table say something about it? Thanks for the help!
Ming,
The answer to your first to questions is yes.
Regarding your third question, about positive/negative, what do you mean by increasing/decreasing the magnitude of the factor? Does this mean, for example, doubling (or halving) all the sample data values?
Charles
For example, the ‘A’ factor is metal concentration with two levels of concentrations 0 and 50, if I increase the concentration from 0 to 50, the response which is metal uptake by the plants also increases. That is if I increase the amount of metal in the water, the amount of metal taken by the plant also increases. Is that what it means if in the anova table it says ‘yes’ in the ‘sig column’ for ‘A’?
Alright. Thanks, Sir Charles.
how did you find the values of cigg, life expectancy from the questionnaire
These are purely made-up numbers, used to illustrate the statistical test.
Charles
Apreciado Dr. Zaionits, reciba un cordial saludo, Dr excuseme una pregunta, si yo hago una tranformación de Box Cox Normal para mis datos, como calculo la inversa de la tranformación para interpretarlos?
Dear Dr. Zaionits, Yours sincerely, Dr Excuse me a question, if I make a transformation of Box Cox Normal for my data, as I do calculating the inverse of the transformation in order to interpret?
Hello,
I was wondering, if I have a survey and want to see the correlation between gender and political affiliation, can that be done with your instructions? I was thinking of coding the responses, (0=female, 1=male) and doing the same with question two. If I have this coded data in excel, can I run a correlation? Thanks.
Diana,
Yes, you can do that. keep in mind that since one of the variables is dichotomous (Male/Female), essentially your test is equivalent to testing whether the mean of question 2 for males is significantly different from that of females (i.f. a t test or Mann-Whitney).
Charles
Hi. I am doing the correlation between no of dengue cases and maximum temperature. Correlation is done by using Spearman, Kendall, and Pearson. My problem is, how to compare which method is best to used? I don’t know what performance evaluation tools should i use. Thank you.
Generally you should use the Pearson correlation coefficient. Only when you want to see whether there is a significant difference between this coefficient and some hypothetical value would you consider using one of these other coefficients. This would be the case if the test assumptions are not met (e.g. normality). These issues are discussed on the website.
Charles
sir
is there difference in the correlation value calculated from excel and the values calculated values from statsitistical software , in case in those data which have been applied formula in excel sheet
No differences that I know of. The correlation coefficient is pretty standard.
Charles
Hi,
I want to represent results of two workshops using correlation
i.e. correlation between time spent on writing user stories and accuracy/ decrease in errors related to that would be time spent in workshop 1 and 2,
Thanks
Vandana
Use the correlation coefficient, as described on this webpage.
Charles
Hi! I want to ask you on what correlation data analysis tool I should use for my study on self-esteem’s relationship with academic performance. I used the Sorensen Self-Esteem Test to evaluate the respondents’ self-esteem and took their GPA’s from last year for the academic performanc. In the Sorensen Self-Esteem Test, you can get four results: Fairly Good, Mild Low, Moderately Low, and Severely Low. What statistical tool should I use to get the correlation coefficient? Thanks.
Jimmy,
You can simply use Excel’s CORREL function to calculate the correlation coefficient. The specific correlation data analysis tool to use really depends on what hypothesis you are trying to test.
Charles
Hello Charles,
If I am analyzing survey results which contain Likert scale answers, is it better to input them as:
strongly disagree = -2
disagree = -1
agree = 1
strongly agree = 2
OR
strongly disagree = 1
disagree = 2
agree = 3
strongly agree = 4
Also wondering something the same thing for a question that asks how long a call took, with answer choices being Less Time than Expected, About as Much Time as Expected, and More Time than Expected. Less=1, About=2, More=3 OR Less=-1, About=0, More=1?
Thank you!
The first scale introduces an implied zero rating, presumably meaning “neutral”. This sort of 5 point Likert scale of -2, -1, 0, 1, 2 should be equivalent to a 1,2,3,4,5 scale, but won’t be equivalent (at least mathematically) to the 1,2,3,4 scale that you have described.
Charles
So if the answer choices do not contain a neutral rating, I should use 1,2,3,4?
Yes
Pls I have data to analyze using spearman rank correlation but don’t know how to go about.
Pls help me as how to go about it. Thanks
Please look at the following webpage:
Spearman Rho
Spearman’s Correlation Hypothesis Testing
Charles
Dear Mr. Zaiontz
I have a question regarding the Kendall Tau function in the Correlation Data Analysis Tool.
Above you state the following: “Observation: The ties correction factor is used for the Kendall’s Tau option of the Correlation data analysis tool.”
Does this “ties correction factor” correspond to Kendalls Tau-b, Kendalls-Tau-c or is it something completely different?
Thanks in advance.
N.
Tau-b is tau-a adjusted for ties.
Charles
Hi. If i have two variables and data points on only one of them is available. However the correlation cofficient between the two variables is given. How do i calculate the data points of the second variable?
You can’t. There are an infinite number of possible values for the second variable that yield the same correlation coefficient.
Charles
i have a problem with converting my original survey results in to statistical analysis. i designed a questionnaire to determine relationship between service quality & promotional effort impact on brand equity.the like-rt scale define results between strongly agree( +2) to strongly disagree(-2).( eg; leasing company should maintain all necessary modern equipment – (agree 3 )which in like-rt scale is 0).how do i convert this results to correlation analysis data.