The chi-square test of independence described in Independence Testing uses categorical data. If the rows and columns in the contingency table are ordered, this ordering is not taken into account. We now show how to take this order into account.
Example
Example 1: 127 people who attended a training course were asked to rate their satisfaction with the course as very dissatisfied, dissatisfied, neutral, satisfied, and very satisfied. We would like to know whether their level of satisfaction is independent of their age category (older, middle, younger) based on the contingency table shown on the left side of Figure 1.
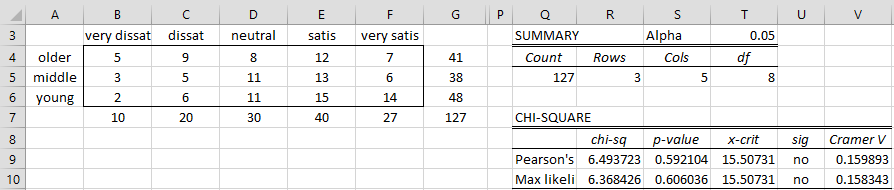
Figure 1 – Chi-square Independence Test
Using Real Statistics’ Chi-square Test for Independence data analysis tool, we obtain the test results shown on the right side of Figure 1. As we can see from the test results (p-value = .59), the level of satisfaction is independent of the age group.
We would get the exact same results if, for example, we exchange the very dissatisfied column with the very satisfied column since the ordering is not taken into account, despite the fact that the ordering may be quite relevant.
Pearson’s correlation approach
We now show how to take the ordering into account using Pearson’s correlation coefficient. First, we need to assign numeric values to the Age and Satisfaction categories that capture the ordering. For example, for the Satisfaction category, we can use a 5-level Likert scale of 1, 2, 3, 4, and 5 for the values very dissatisfied to very satisfied. The results we will obtain will be identical if we reverse the scale 5, 4, 3, 2, 1 or use -2, -1, 0, 1, 2, or even 0, 2, 4, 6, 8. The important thing is that the order is captured and the space between the ranking is the same (to give equal weights to the rankings).
We don’t even need to use equally spaced ranking, although the test results would be different. E.g. -3, -1, 0, 1, 3, would give more weight to the extreme ranks and -3, -2, 0, 2, 3 would give more weight to the difference between satisfaction and dissatisfaction.
Test statistic
The test statistic we use is
M2 = (n–1)r2 ∼ χ2(1)
where r is the correlation coefficient between the Age and Satisfaction rankings.
Reformatting contingency table
First, we note that the contingency table can be reformatted as a frequency table, similar to those described in Frequency Table Conversion, except now we have pairs of values instead of single values. This just means that we reformat the contingency table in standard (stacked) format as described in Example 3 of Independence Testing. This is done for Example 1, as shown in Figure 2.
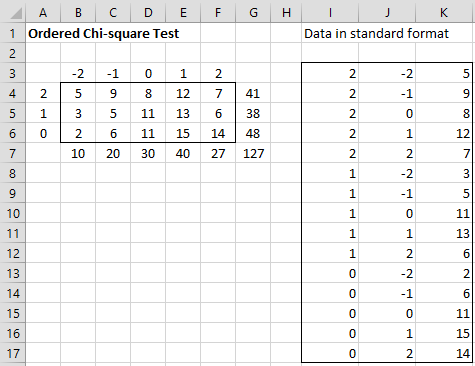
Figure 2 – Converting the contingency table to stacked format
The left side of the figure shows the contingency table with suitable numeric column and row headings. The right side shows the equivalent data in standard format. In fact, range I3:K17 can be filled using the array formula =Anova2Std(A3:F6).
Conducting the test
We now conduct the test using the M2 statistic, as shown in Figure 3.
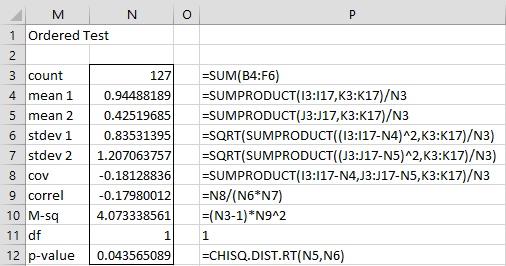
Figure 3 – Ordered Chi-square Test for Independence
Most of the formulas in this figure are used to calculate the correlation coefficient in cell N9. The approach is as described in Frequency Table Conversion. As explained there, we could have calculated the correlation coefficient using the array formula
=CORREL(Freq2RAW(I3:I17,K3:K17),Freq2RAW(J3:K17))
We see from cell N12 that p-value = .044, and so using this test we conclude that the Age and Satisfaction categories are not independent, i.e. there is a difference in the level of satisfaction based on age, the opposite of our conclusions using the standard chi-square test of independence.
Kendall’s correlation approach
The approach using Pearson’s correlation depends on the rankings chosen for the ordered categories. If we use Kendall’s correlation, then the results will only depend on the ordering and not the rankings.
For Example 1, Kendall’s test can be performed as shown in Figure 4. The results are obtained by placing the following array formula in range R4:S10:
=KCORREL(Freq2RAW(I3:I17,K3:K17),Freq2RAW(J3:K17),TRUE,,S3)
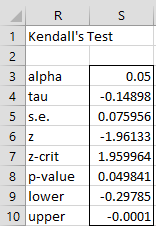
Figure 4 – Kendall’s test of independence
Since p-value = .0498 (cell S8), we again can conclude that satisfaction depends on age with 95% confidence.
Real Statistics Support
Click here to see how to conduct Pearson’s and Kendall’s tests using the Real Statistics Chi-square Test of Independence data analysis tool.
Examples Workbook
Click here to download the Excel workbook with the examples described on this webpage.
References
Howell, D. C. (2001) Chi-square with ordinal data
https://www.uvm.edu/~statdhtx/StatPages/More_Stuff/OrdinalChisq/OrdinalChiSq.html
Agresti, A. (1996) An introduction to categorical data analysis. New York: Wiley.