Basic Concepts
In Relationship between Correlation and t Test and Relationship between Correlation and Chi-square Test we introduced the point-biserial correlation coefficient, which is simply the Pearson’s correlation coefficient when one of the samples is dichotomous.
The biserial correlation coefficient is also a correlation coefficient where one of the samples is measured as dichotomous, but where that sample is really normally distributed. In such cases, the point-biserial correlation generally under-reports the true value of the association. The biserial correlation coefficient provides a better estimate in this case.
Assuming that we have two sets X = {x1, …, xn} and Y = {y1, …, yn} where the xi are 0 or 1, then the biserial correlation coefficient, denoted rb, is calculated as follows:
![]()
Where n0 = number of elements in X which are 0, n1 = the number of elements in X which are 1 (and so n = n0+n1), p0 = n0/n, p1 = n1/n, m0 = the mean of {yi: xi = 0}, m1 = the mean of {yi: xi = 1}, s is the population standard deviation of Y and
y = NORM.S.DIST(NORM.S.INV(p0),FALSE)
The biserial correlation coefficient can also be computed from the point-biserial correlation coefficient using the following formula
 Example
Example 1: Calculate the biserial correlation coefficient for the data in columns A and B of Figure 1.
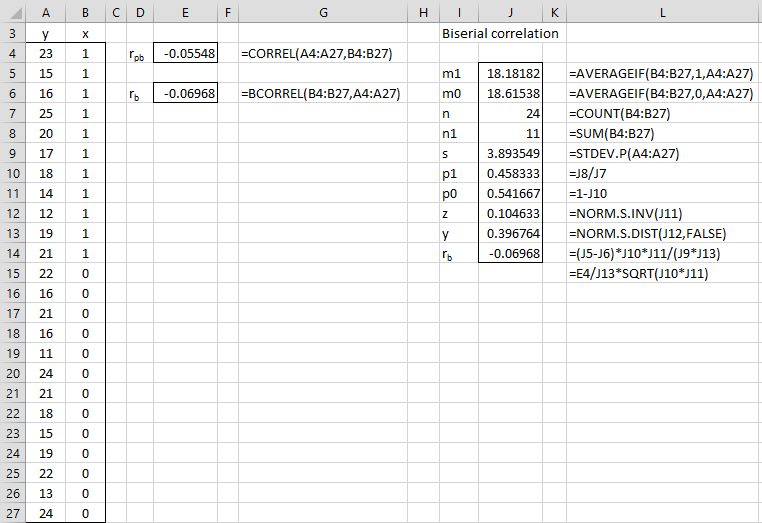
Figure 1 – Biserial Correlation Coefficient
The biserial correlation of -.06968 (cell J14) is calculated as shown in column L. Note that the value is a little more negative than the point-biserial correlation (cell E4).
Worksheet Function
Real Statistics Function: The following function is provided in the Real Statistics Resource Pack.
BCORREL(R1, R2) = the biserial correlation coefficient corresponding to the data in column ranges R1 and R2, where R1 is assumed to contain only 0’s and 1’s.
The biserial correlation coefficient for Example 1 can be calculated using the BCORREL function, as shown in cell G6 of Figure 1.
Confidence Interval
The following statistic is standard normally distributed

Here, x′ = FISHER(x) and the denominator is the standard error. We can use z to test whether ρb is significantly different from zero based on the two-tailed p-value = 2*NORM.S.DIST(-ABS(z), TRUE).
The 1–α confidence interval for (2ρb/√5)′ is
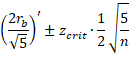
where =NORM.S.INV(1–α/2). Taking the Fisher inverse of these confidence interval limits yields the limits of a confidence interval for 2ρb/√5. Multiplying these limits by √5/2 produces confidence interval limits for ρb.
For Example 1, z = -.27, as calculated in cell O7 of Figure 2. Since p-value = .78, we conclude that ρb is not significantly different from zero. We also see that the confidence interval for ρb is (-.525, .410).
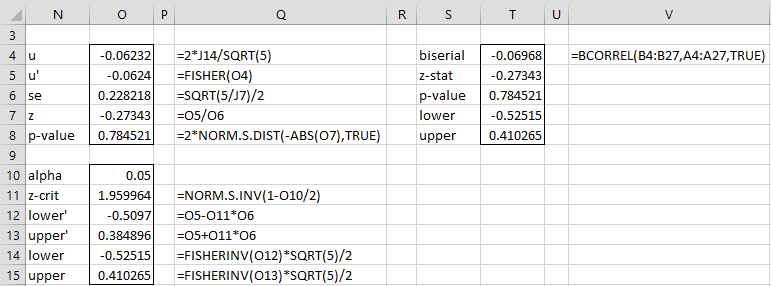
Figure 2 – Confidence interval for biserial correlation
Worksheet Function (continued)
Real Statistics Function: BCORREL is actually an array function as follows:
BCORREL(R1, R2, lab, alpha) = a column array with the following five values: the biserial correlation coefficient for the data in R1 and R2, z-statistic, p-value and left and right limits of the 1–alpha confidence interval.
Here R1 and R2 are numeric column arrays with the same number of rows. R1 is assumed to contain only 0’s and 1’s. If lab = TRUE then an extra column of labels is appended to the output (default FALSE) and alpha = the significance level (default .05).
For Example 1, the output from =BCORREL(B4:B24,A4:A24,TRUE) is shown in range T4:T8 of Figure 2.
Examples Workbook
Click here to download the Excel workbook with the examples described on this webpage.
References
NCSS (2016) Point-biserial and biserial correlations
https://www.ncss.com/wp-content/themes/ncss/pdf/Procedures/NCSS/Point-Biserial_and_Biserial_Correlations.pdf
Rikhi, M. (2024) Biserial correlation
No longer available online
Thanks for this great ressource! I was wondering: how does r_b compute if we apply the Bessel correction for (small) samples and use the sample standard deviation? Is it a similar transformation as for the point-biserial correlation coefficient, i.e.
r_b = (m_1 – m_2)/sy * [N*p_0*p_1/(N-1)]
?
Matthias,
If s is the population standard deviation and t is the sample standard deviation, then s = t(n-1)/n, and so you can replace s by t(n-1)/n in the formula for r_b.
Charles
Great, thanks a lot, Charles!
What should I do if I want to perform point-biserial correlation but the sample size is very small. ie one up has 6 and the other has 8.
The point-biserial correlation is equivalent to the usual Pearson correlation. This is calculated for pairs of data elements. In this case, if one of the pairs comes from set A and the other from set B, then A and B need to have the same number of elements. One can’t have 6 elements and the other 8.
Charles
Hello Charles,
Thank you for all the help you provide through your articles on this website and the Real Statistics Tool Pack. I’m currently writing my master’s thesis, and your material has helped me greatly!
I need to perform a rank-biserial correlation. Is it possible to do so with the Real Statistics Tool Pack?
Thank you very much in advance!
Adriana,
The rank-biserial correlation can be calculated by Excel’s CORREL function.
Charles
Hi
How do I output all the results of BCORREL function? I want to calculate the p-value
BCORREL is an array function and so to see all the output you can’t simply press Enter. See the following webpage for how to use an array function:
Array Formulas and Functions
Charles
Thank you very much for your answer. I need to manually enter the formula in my Excel but not insert the function. I just calculated the p value just now.
It is candidates answered the item i correctly over total number of candidates who received the question in the test.
Thank you for providing the article for us. It is very useful. I have some questions:
1. What is the minimum number of samples to perform the test?
2. If most of the dichotomised data (say 90%) are 1 and the rest are 0, are the samples still applicable? Does it have any restrictions?
I will appreciate it if you can provide reference sources for my questions. Thank you so much.
Hello Raymond,
You can calculate the biserial correlation even with very small samples and even when most of the data are 1’s. The usual question regarding sample sizes relates to statistical power and precision of the confidence interval. Since the statistic given on this webpage is normally distributed, you can use the tests for power and confidence interval precision for the normal distribution. I don’t know how big a sample you need before the normal distribution approximation holds. Most of the time this is around 30 based on the central limit theorem, but I don’t know whether this is the case here.
Charles
Hello,
I ran biserial correlations between continuous and binary variables in SPSS on a large dataset of 762 patients. I correlated 138 regional brain volumes with 7 binary cognitive outcomes to explore the association between regional brain tissue volumes and cognitive impairment.
I got pretty low values in the range of ,087 that came out as significant at the 0.05 level. My strongest correlations are around the value of ,2 and came out as significant at the 0.01 level. I’m wondering if it’s normal to obtain so many significant associations because most coefficients are pretty far from the maximum value of 1.
What can be considered a weak/moderate/strong biserial correlation?
Thank you for your help in advance.
Angelina,
With large sample sizes, you can get a significant result even when the effect is small. A significant result doesn’t necessarily mean a large effect.
Charles
Hi Charles,
Many thanks for this, and your other wonderful articles. I had been calculating a biserial correlation by hand and have got a result that is outside the [-1, 1] interval for a correlation. I know this seems odd, very odd, and impossible; but I cannot for the sake of me find the error in my approach. My data is:
Group 1: {20, 17, 18, 22} and Group 2: {7, 6, 9} the parameters are as follows:
m1 = 19.25
m0 = 7.333333333
p1 = 0.571428571
p0 = 0.428571429
s = 6.12788874
z = -0.18001237
y = 0.392530609
Resulting in a biserial correlation of = 1.213264688. Errrrr.
Can you see the error in my calculation? Kindest regards.
Jonathan
Hello Jonathan,
I am quite pleased that you are getting value from the website. Thank you for your feedback.
There are two problems with using the biserial correlation coefficient with your data: (1) the sample sizes must be equal and (2) one of the samples can only take 0 or 1 values. Since these two assumptions don’t hold for your data, you can’t use the biserial correlation.
Charles
Hi Charles,
Thanks for the prompt reply.
Yes, both groups are of different sizes. With that said, group membership is the independent variable, group 1 -> 0, and group 2 -> 1. The values in the sets are the measurements on the dependent variable, listed for each group. Does the sample sizes still violate a condition? I would be really interested in why this is the case and a reference to further reading would be great.
I have been reading: Corder and Foreman “Non-parametric Statistics …” but cannot seem to locate anything.
Kindest regards,
Jonathan
hello Jonathan,
Thanks for the clarification. Your calculation of the biserial correlation is correct and indeed it is larger than 1. There is an underlying assumption of normality, which perhaps is being violated. I have not yet found clarification of this issue.
Charles
Thanks, Charles.
You might be interested in: https://ncss-wpengine.netdna-ssl.com/wp-content/themes/ncss/pdf/Procedures/NCSS/Point-Biserial_and_Biserial_Correlations.pdf
That has a citation to Tate (1954, 1955), Kraemer (2004) and Sheskin (2011).
There seems to be some type of correction to the point-biserial and hence the biserial, the square root of n/(n-1). Which tends to 1 with n >> large.
Thanks for your time, Charles.
Jonathan
Hi Jonathan,
Thanks for giving me this reference. I will look into it.
Charles
Hi Charles,
I donot get a function if I type =BCORREL in excel. do I need to enable or download this function from somewhere?
Hello Maha,
You need to download and install the Real Statistics add-in. It is free. See
Real Statistics Resource Pack
Charles
Sorry for my ignorance. I am interested is the CI for the point-biserial correlation value (i.e., in this example the CI of Rbp = -.05), but the example offers the CI of “ρb”… and I can not understand what this term refers to.
Hi Matt,
ρ_b = the biserial correlation.
ρ_pb = the point-biserial correlation coefficient, which is equivalent to the usual Pearson’s correlation coefficient and can be calculated in Excel using the CORREL function.
To get the confidence interval for this coefficient go to
https://real-statistics.com/correlation/one-sample-hypothesis-testing-correlation/correlation-testing-via-t-test/
or
https://real-statistics.com/correlation/one-sample-hypothesis-testing-correlation/correlation-testing-via-fisher-transformation/
Charles
Hi Charles,
Thank you, again, for the material. I’m working now with the biserial and point-biserial correlations and your BCORREL was a nice tool. Just noted that you use the sample variance in BCORREL. You may consider offering also a variant that uses the population variance? After all, the Pearson p-m correlation uses also with the point-biserial correlation (explicitly and embeddedly) the population variances of the item and the score. Also, the p0 x p1 refer to the population variance of the item. Hence, comparing the estimates on rpb and rb would be easier (or would make more sense) if the same underlying statistics are used in the calculation? Makes sense?
Hello Jari,
Thanks for your feedback. I will look into this. I am planning to add support for confidence intervals as well.
Charles
Can we extend the UDF to conduct Polyserial correlation?
Gagandeep,
Real Statistics hasn’t implemented a polyserial correlation function yet.
Charles
Hello,
Can point bi-serial correlations be run when the continuous variables data is not normally distributed ?? does it have to be normally distributed for the test to work?
Millie,
The point biserial correlation is not a test. It is a statistic. The data does not have to be normally distributed. There are tests to see whether the point biserial correlation is equal to some specific value. The usual tests require that the data be normally distributed. Note that the point biserial correlation is equal to the usual Pearson’s correlation.
Charles
Do you have any literature recommendations that state that in calculating the biserial point correlation, the data does not have to be normally distributed? do you also know any other assumptions that must be fulfilled for the biserial point correlation?
I just searched for such information but didn’t find any.
Charles
Charles,
Thank you very much for all the work you do on your website, I have found the information you provide extremely helpful.
I was hoping I could pick your brain on what you think would be the most appropriate statistical test for a particular set of data.
I want to analyse the impact of turning a production line on and off (variable X, binary) on the environmental quality of wastewater being discharged; more specifically, the suspended solids content (variable Y, continuous). I have a set of daily data for a whole month, which shows if the production line was running or not, and the respective suspended solids content for those days. In other words, I have a data set similar to below:
15th January X=0 (line was not running) Y=110 mg/l
16th January X=1 (line was running) Y=210 mg/l
17th January X=1 Y=245 mg/l
18th January X=0 Y=170 mg/l
And so on.
I’m looking for a statistical test that can analyse the relationship between the X and Y variables; in other words, to statistically prove whether running the production line has a significant impact on suspended solids content.
I was wondering:
a) Would a biserial correlation test be the most appropriate test to use?
b) If this is not the most appropriate test, are you aware of something I could use instead?
Any advice you could provide on this matter would be extremely appreciated.
Many thanks for all your help.
All the best,
Max
Max,
Essentially you have two samples, namely the Y values when X = 1 and the Y values when X = 0. You can use a two sample t test to determine whether there is a significant difference between these two sets. If the assumptions for a t test are not satisfied (primarily normality), then you can use a Mann-Whitney test.
Note this test is equivalent to testing the Pearson correlation, but it is easier (at least for me) to think of it as a two sample t test.
Charles
Charles,
That’s perfect, I’ll look into using a t test – thank you very much!
Max
Hi Charles:
Thank you for the very helpful website. I am trying to find the discriminant factor for how well students do a particular test and their performance on an individual test. I have the overall percentages (interval score) and their performance on a specific question, right vs wrong (dichotomous). I know that under a bivariate situation, I would simply use your bcorrel function; however, my questions are:
1) how do I avoid the type 2 error when I am comparing so many variables against dependent variable. Would I do an ANOVA test?
2) What do I do if my data is not normally distributed? I read on your website about Mann-Whitney but does that work for the point-biserial situation?
Yousaf,
Sorry, but I don’t understand your question.
Charles
Hi Charles,
Thanks for your site. Hats off! I recommended it in my book (Essentials of Research Methods in Human Sciances, SAGE 2017).
The form of the biserial formula is quite handy for my purposes – I have derived a parallel form of it which shows why the biserial correlation cannot give the perfect 1 except in one specific data structure of X and Y. Now, I’m working on with polytomous variables (X) in relation with a continuous (Y). I have tried to find a parallel form of the formula for including the element (M1-M0) – like (M1-M0)+(M2-M1)+(M2-M0)+A or (M1-GM)^2+(M2-GM)^2+A. Have you even pumbed into these kinds of forms? Any ideas?
Hello Jari,
Thank you for recommending my website in your book.
I haven’t really investigated the biserial formula further than what appears in the website.
Charles
Hi Charles,
Is it possible to calculate biserial correlation in excel using the means and standard deviations of 2 groups but without knowing if the data is normally distributed? I am extracting data for a meta-analysis so I do not have the raw data.
Thank you very much
Samantha,
It sounds like you don’t have information to calculate m_0 and m_1, and so won’t be able to calculate the biserial correlation.
You do have enough information to calculate the point-biserial correlation, though.
Charles
Hello Charles,
First of all, thank you for sharing all the material on Statistics, it has been very useful to me.
My question is, is there a way to use point-biserial correlation for multiple independent and dependent variables in Excel? (Like a “Multivariate multiple point-biserial correlation”) I have been looking for information, but I have only found “Multiple point-biserial correlation” using SPSS.
Thank you!
Sylvia,
Point-biserial correlation is just a special case of the usual Pearson’s correlation. You can calculate Pearson’s correlation (and therefore point-biserial correlation) when there are multiple independent variables using regression. You can also calculate this value by using the Real Statistics function RSquare(Rx,Ry) where Rx is a range that contains the data for the independent variables and Ry is a range that contains the data for the dependent variable.
Charles
Thanks for the great toolkit! It has saved me a lot of time!
I am getting some strange values from the BCORREL function. e.g. one of the biserial correlations has come out as 17.232, which I checked and is correct against the formula supplied above. However, shouldn’t the value for r be between 0 and 1?
This is the data input into the formula:
m1 900.000
m0 0.035
n1 2.000
n0 8501.000
n 8503.000
s 13.929
p1 0.000
p0 1.000
z 3.497
y 0.001
r 17.232
Sorry, I noticed the precision has caused some inaccuracies in the numbers I supplied. Here they are to five places:
m1 900.00000
m0 0.03529
n1 2.00000
n0 8501.00000
n 8503.00000
s 13.92878
p1 0.00024
p0 0.99976
z 3.49706
y 0.00088
r 17.23214
Tony,
Yes, I thought that r should be between -1 and 1, although I have never checked to see whether this is always true, especially in extreme situations.
You should check the values for m0, m1, s.
You have a very extreme situation since you only have two ones out of 8,503 data elements. According to the following source, you shouldn’t use the biserial correlation when p0 > .9.
http://changingminds.org/explanations/research/analysis/biserial.htm
Charles
Thanks for the response, Charles.
Yes, it is an extreme dataset. I appreciate the source. I will investigate further.
Tony
how to calculate y?
Anitha,
The calculation is shown on the referenced webpage
y = NORM.S.DIST(NORM.S.INV(p0),FALSE) where p0 is as described on the webpage.
Charles