We now extend the approach for one-sample hypothesis testing of the correlation coefficient to two samples.
Topics
- Two independent sample pairs – this webpage
- Two dependent sample pairs with one sample in common (overlapping case)
- Two dependent sample pairs with no sample in common (non-overlapping case)
- Power and Sample Size
- Correlation Testing with more than two samples
Property
Property 1: Suppose r1 and r2 are as in the Property 1 of Correlation Testing via Fisher Transformation where r1 and r2 are based on independent samples and further suppose that ρ1 = ρ2. If z is defined as follows, then z ∼ N(0, 1).
![]()
where
Proof: By Property 1 of Correlation Testing via Fisher Transformation for i = 1, 2
![]()
By Properties 1 and 2 of Basic Characteristics of the Normal Distribution, it follows that
![]()
where s is as defined above. Since ρ1 = ρ2 it follows that ρ´1 = ρ´2, and so
![]()
from which the result follows.
We can use Property 1 to test whether the correlation coefficients of two populations are equal based on taking a sample from each population and comparing the correlation coefficients of the samples.
Example
Example 1: A sample of 40 couples from London is taken comparing the husband’s IQ with his wife’s. The correlation coefficient for the sample is .77. Is this significantly different from the correlation coefficient of .68 for a sample of 30 couples from Paris?
H0: ρ1 = ρ2


s = SQRT(1/(n1 – 3) + 1/(n2 – 3)) = SQRT(1/37 + 1/27) = 0.253
z = (
p-value = 2(1 – NORM.S.DIST(z, TRUE) = 2(1 – NORM.S.DIST(.755, TRUE)) = 0.45
We next perform either one of the following tests:
p-value = .45 > .05 = α
zcrit = NORM.S.INV(1 – α/2) = NORM.S.INV(.975) = 1.96 > .755 = z
In either case, the null hypothesis is not rejected. We summarize these results in Figure 1.
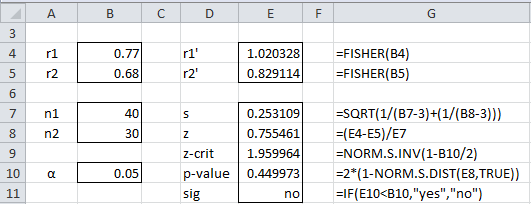
Figure 1 – Two sample correlation test
Related Tests
Note that in Example 1 the couples from Paris are selected independently from the couples from London. A different test is required if the samples are dependent.
Click here for an example of how to perform Two Sample Hypothesis Testing for Correlation with Overlapping Dependent Samples.
Click here for an example of how to perform Two Sample Hypothesis Testing for Correlation with Non-overlapping Dependent Samples.
Worksheet Functions
Real Statistics Functions: The Real Statistics Resource Pack supplies the following array function.
Correl2Test(r1, n1, r2, n2, alpha, lab): array function which outputs: z, p-value (two-tailed), and the lower and upper bounds of the 1 – alpha confidence interval, where r1 and n1 are the correlation coefficient and sample size for the first sample and r2 and n2 are similar values for the second sample.
Correl2Test(R1, R2, R3, R4, alpha, lab) = CorrelTest(r1, n1, r2, n2, alpha, lab) where r1 = CORREL(R1, R2), n1 = the common sample size between R1 and R2 (i.e. the number of pairs from R1 and R2 which both contain numeric data), r2 = CORREL(R3, R4) and n2 = the common sample size between R3 and R4.
If lab = TRUE then the output takes the form of a 4 × 2 range with the first column consisting of labels, while if lab = False (default) then the output takes the form of a 4 × 1 range without labels. If alpha is omitted it defaults to .05.
Correl2Test(.77,40,.68,30,.05) generates the values z = .755 and p-value = .45, consistent with what we observed in Figure 1, plus lower = -.296 and upper = .596. Since 0 is in the confidence interval (-.296, .596) the test is not significant and we cannot reject the null hypothesis that the two correlation coefficients are equal.
Examples Workbook
Click here to download the Excel workbook with the examples described on this webpage.
References
Howell, D. C. (2010) Statistical methods for psychology (7th ed.). Wadsworth, Cengage Learning.
https://labs.la.utexas.edu/gilden/files/2016/05/Statistics-Text.pdf
NCSS (2023) Tests for two correlations
https://www.ncss.com/wp-content/themes/ncss/pdf/Procedures/PASS/Tests_for_Two_Correlations.pdf
Dear Charles
Thanks for the clear explanation about Two Sample Hypothesis Testing for Correlation.
Are there any issues with negative z scores? I’m assuming this is Ok as it shows the score is so below the mean?
Also another work showed for Spearman corr the value 1.06 is more appropriate than 1.0 in SE estimate
Dear Bal,
I try to do my best to be clear about the explanations, although sometimes I fall short.
Yes, the z score can be negative, which would occur below the mean.
Where should the value 1.06 be used in place of the 1.0 when creating the SE estimate? Which work showed this since I would like to follow up on this?
Charles
Hi Charles
Thanks for the reply and you do a great job at explaining.
I found the info during a web search on https://community.ibm.com/community/user/question/comparison-between-correlation-coefficients
Here it is:
Bruce Weaver
posted Thu March 27, 2025 09:29 AM
For some reason, I am unable to reply to Scott’s post. Scott, the code you posted looks right for comparing twoindependent Pearson correlations. But when you apply Fisher’s r-to-Z to a Spearman correlation, the
Fieller
,Hartley, & Pearson (1957) SE for Zr is SQRT(
1.06
/(n-3)), So, you need to tweak your line that computes the SEof the difference:
COMPUTE stderr = sqrt((
1.06
/(n1-3))+(
1.06
/(n2-3))).
I hope this helps. And I hope this post works, as I keep seeing a “403 Forbidden” message pop up as Icompose this reply!
Cheers,
Bruce
Did not enquire much further (there is a ref declared) and recall another source somewhere that more or les stated the same thing for spearmen correl.
Hope this helps
regards
bal
Bal,
Thanks for the follow-up. I found a paper by Douglas G. Bonett and Thomas A. Wright which may shed some light on this issue. I am hoping that it is related to the reference you sent me.
I am on vacation now, but I will read the paper when I return next week.
Charles
Bal,
Thank you for your suggestion. I plan to add the suggested enhancements for Spearman’s and Kendall’s correlation to the next release, Rel 9.6. I am targeting this release before the end of July.
Charles
Dear Charles,
Thank you very much for your clear statements and example codes. I really benefited a lot.
1-) if i am not wrong, this equation (p-value = 2(1 – NORM.S.DIST(z, TRUE) = 2(1 – NORM.S.DIST(.522, TRUE)) = 0.45) should be p-value = 2(1 – NORM.S.DIST(z, TRUE) = 2(1 – NORM.S.DIST(0.755, TRUE)) = 0.45. z value should be change to 0.755.
2-) I want to ask that i see an article that use z=(r1′-r2′)/standart deviation (r1′-r2′). In that article they have 11 controls and 11 patients, they measure 320 point time series from different brain region of each subject. And they calculate pearson corrleaiton(PC) betweeen these time series. As a result they have 11 PC for control and 11 patients. They compared this PC between control and patients. They transfom to all PC to Z. So they have 11 r1′ and 11 r2′. And they calculate p value from this translated PCs.
But calculation of s is very diffirent from yours. You use s=sqrt(1/(n1-3)+1/(n2-3)) but in that article they use s=std(r1′-r2′). What is the differences? Can use std(r1′-r2′) ?
Thank you very much.
Best Regards.
Hello Sabri,
1. Thanks for finding this error. I just made the correction on the webpage. I appreciate your help in improving the reliability of the website.
2. I don’t know what the std(x,y) function is, so it is difficult for me to comment. But if std is sqrt, then I don’t know how they came up with this standard deviation. It is completely different from the estimate on the webpage. I would have to see the article.
Charles
Hi: I am trying to test correlation between Fed Rate and Inflation Rate from 1981 to 2021. I copied the data from Fed Records and ran correlation analysis online free. It returned with NaN ? with All values for each calculation = 0.
Hello Ram,
This should not happen. There is a mistake somewhere.
Charles
Hi thank you
I wanted to check if this would be appropriate for my test. I am looking into well-being in my group of participants who use a new social media site. I have a control group where they use two other popular sites (the reason is because many people don’t only use one social media site- so i was going to control for this). I was going to do a correlation between the use of a new social media app and well-being and then do a correlation between the control group’s use of social media and well-being. Then do a T-test between the two groups to see if they significantly differ? Do you advise this is the correct way to conduct my stats?
Sam,
I am not sure how you plan to combine the two correlations into a t-test.
Essentially you have two groups: treatment group (uses new app or apps) vs control group and subjects in both groups are tested for well-being. You can do a two-sample t-test where the first sample consists of the well-being scores of the treatment group and the second sample consists of the well-being scores of the subjects in the control group.
Charles
Hello Charles, my question is this: I am looking for the correlation between life satisfaction and sexual satisfaction in a sample of 47 people. The correlation is a weak positive one. (0,33) Now I want to examine if the correlations differ between males and females. (I suppose I should make an independent samples t-test) But I don’t know how to do that with correlations. I also don’t know how to make different correlation calculations based on gender. What should I do? (I do that on SPSS)
Hello Bahar,
This is described on this webpage. In fact, Example 1 explains how to conduct such a test. The correlation between a husband and wife is replaced by the correlation between life and sexual satisfaction. And the relationship between London and Paris is replaced by the relationship between Male and Female.
Charles
Hi Charles, you have made a very impressive and informative webpage.
Based on the calculation above, I wonder if the method is suitable for my project.
My case is to test if the intraclass correlation coefficient (ICC) between genders of a biomarker is significantly different or not. Since there is no publication in this topic and I have been looking for a suitable method for the hypothesis test and I am not sure if your method is the right way to do.
Hello Charles,
I have a question about correlation. I have a number of correlation coefficients betwen two variables A and B. I calculate the correlation coefficient for each subject (say n=10), so 10 values of r. Most of them are negative. Now I would like to test whether the correlation is on average negative. Does it make sense to make a one-sample t-test on the 10 values of r ?
Dear Charles,
Will the df always be n-3 in this test?
Anna,
Since the normal distribution is used there is no df.
Charles
Hi Charles,
I am seeking to compare either the Kendall’s Tau value of two independent samples or the Spearman’s Rho of two independent samples. That is I have an estimate of the correlation between x and y for sample 1 and that of sample 2. The samples are independent. However, the sample size in each group is small (n1=15 n2=35) and the data for x and y is not normal in either sample (this is the reason I would use either Kendall’s Tau or Spearmans’s Rho instead of Pearson’s in each of the samples).
Is there a test to compare the Kendall’s tau or the Spearman’s Rho of 2 independent samples?
Any guidance would be greatly appreciated.
-Maggie
Biostat II
Maggie,
If I remember correctly, with Spearman’s rho you are just calculating Pearson’s correlation on the ranks of the two pairs in the samples. If you are comparing two independent sample pairs, you should be able to use the test of two independent sample pairs described on the referenced webpage, but on the ranks not on the original data.
I don’t how to do this for Kendall’s tau.
Charles
Hi and thank you for the nice informative pages.
Since I am not a very experienced user I must ask.
I use your correl2test(r1, n1, r2, n2, alpha, lab)
as follows =correl2test( 0,569;10190;0,641; 2039;0,05)
but not get only one number instead of 4
I get -4,652529256
By the way I have excel2010
Thank you in advance
Regards Gustaf
Gustaf,
Correl2Test is an array function and so you can’t simply highlight one cell and press the Enter key. You need to highlight a column range with at least 4 cells and press Ctrl-Shift-Enter. See Array Formulas and Functions for more details.
Charles
Thank you Charles,
I will check it out.
I had some trouble with your p-value also so I solved it like this:
The cell for the p-value: =IF(AW4>=0; 2*(1-NORM.DIST(AW4;0;1;TRUE));2*NORM.DIST(AW4;0;1;TRUE))
where AW4 is the z.
The NORM.DIST is a new function from Excel. The other one NORMSDIST does not work anymore apparently.
I have a question though. I now tested the hypothesis that of equality. What if I tested Ho: rho1>rho2. Any tips for me there?
I am very thankful for your commitment to these pages you offer by the way.
/Gustaf
Gustaf,
You could also use the formula =2*(1-NORM.DIST(ABS(AW4);0;1;TRUE)) or =2*(1-NORM.S.DIST(ABS(AW4);TRUE)).
The formula NORMSDIST still works on my computer. I understood that Excel still supports this function, but wants people to migrate to NORM.DIST.
I beleive that if you are testing Ho: rho1>rho2, then you should use a one-tail test, i.e. =1-NORM.S.DIST(ABS(AW4);TRUE).
Charles