In Independence Testing we use the chi-square test to determine whether two variables are independent. We now look at the same problem using the correlation coefficient with dichotomous dummy variables.
Example
Example 1: Calculate the point-biserial correlation coefficient for the data in Example 2 of Independence Testing (repeated in Figure 1) using dichotomous variables.

Figure 1 – Contingency table for data in Example 1
Define the random variable x such that x = 1 if the patient is cured and x = 0 if the patient is not cured, and define y = 1 if therapy 1 is used and y = 0 if therapy 2 is used. Thus for 31 patients x = 1 and y = 1, for 11 patients x = 0 and y = 1, for 57 patients x = 1 and y = 0 and for 51 patients x = 0 and y = 0.
If we list all 150 pairs of x and y as shown in range P3:Q152 of Figure 2 (only the first 6 data rows are displayed) we can calculate the correlation coefficient using the CORREL function to get r = .192.

Figure 2 – Calculation of the point-biserial correlation coefficient
Alternative Approach
Instead of listing all the n pairs of samples values and using the CORREL function, we can calculate the correlation coefficient using Property 3 of Relationship between Correlation and t Test, which is especially useful for large values of n. This is shown in Figure 3.
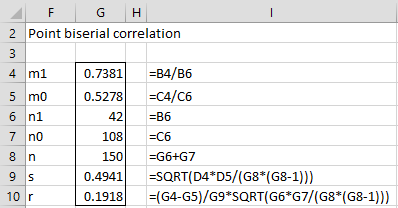
Figure 3 – Alternative approach
Actually, based on a little algebra it is easy to see that the correlation coefficient can also be calculated using the formula =(B4*C6-C4*B6)/SQRT(B6*C6*D4*D5).
Key Property
Property 1: For problems such as those in Example 1, if ρ = 0 (the null hypothesis), then nr2 ~ χ2(1).
Property 1 provides an alternative method for carrying out chi-square tests such as the test we performed in Example 2 of Independence Testing.
Example 2: Using Property 1, determine whether there is a significant difference in the two therapies for curing patients of cocaine dependence based on the data in Figure 1.
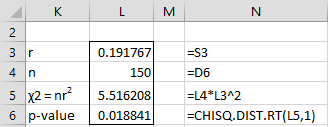
Figure 4 – Chi-square test for Example 2
Note that the chi-square value of 5.516 is the same as we saw in Example 2 of Chi-square Test of Independence. Since the p-value = CHISQ.TEST.RT(5.516,1) = 0.0188 < .05 = α, we again reject the null hypothesis and conclude there is a significant difference between the two therapies. For versions of Excel prior to Excel 2010 we use CHIDIST instead of CHISQ.DIST.RT.
Effect size
Property 1 also provides an alternative way to calculate the phi measure of effect size for the chi-square test of independence (see Independence Testing). In particular, φ = r = 
Care should be taken with the use of φ since even relatively small values can indicate an important effect. E.g. in the previous example, there is clearly an important difference between the two therapies (not just a significant difference), but if you look at r we see that only 4.3% of the variance is explained by the choice of therapy.
In Example 1 we calculated the correlation coefficient of x with y by listing all 132 values and then using Excel’s correlation function CORREL. The following is an alternative approach for calculating r, which is especially useful if n is very large.

Figure 5 – Calculation of r for data in Example 1
First, we repeat the data from Figure 1 using the dummy variables x and y (in range F4:H7). Essentially this is a frequency table. We then calculate the mean of x and y. E.g. the mean of x (in cell F10) is calculated by the formula =SUMPRODUCT(F4:F7,H4:H7)/H8.
Next we calculate 
Examples Workbook
Click here to download the Excel workbook with the examples described on this webpage.
References
Newsom, J. T. (2023) t-tests, chi-squares, phi, correlations: It’s all the same stuff
https://web.pdx.edu/~newsomj/uvclass/ho_correlation%20t%20phi.pdf
Millson, J. (2017) Independence, covariance and correlation of discrete random variables
https://www.math.umd.edu/~millson/teaching/STAT400fall18/slides/article16.pdf
this message is just to say that this page is amazing and thank you!
Which is better method to find relationship between attributes, either pearson correlation or pearson chi square method?
Ronak,
As this webpage states they are equivalent.
Charles
Hi Ronak,
To find the relations between two variables you can use correlation and to find whether two variables are independent or not we have to use chi-square.
Chi-square is used only for frequencies .
Hi Charles,
Is chi-square the appropriate statistic in determining the relationship between learning strategies (very high, high, average, low or very low) and learning styles (very high, high, average, low and very low)? I’m confused. Please enlighten me.
Thanks in advance.
Al
Hello,
Since the values for the two factors are ordered, you should use the ordered version of the chi-square test. See the following webpage:
Ordered Chi-square Test
Charles
Good day sir! what is the difference between test for association and test for independence in Chi-square?
Kent,
See the following webpage:
https://newonlinecourses.science.psu.edu/stat504/node/75/
Charles
Is there any situation where Chi square and pearson corelation give different result? I tested the data on gender and education level , chi square shows that they are not independent, mean they are inter related but pearson corelation shows no relation in between them. Please clarify?
Bharti,
If you are saying that the Chi-square test for independence and the Correlation test are not equivalent, as described on this webpage, please send me an Excel file with a counter-example.
Charles
This happened to me too. My teacher says there is a reason but I can’t findn one online.
Pearson correlation can show both strength and direction relationship low,high,very high,moderate,direction for example as x increase y increase but in chi square cant show
Hi Charles,
What is the difference between using a chi square and a spearmans rho correlation. I was told that if I have two categorical variables, both ordered, that a Spearman’s rho correlation should be used, but why not a chi square?
Thank you!
Chrissy,
This webpage is basically saying that the chi-square test for a 2 x 2 matrix is equivalent to a test of the Pearson’s correlation. Spearman’s correlation is not the same thing as Pearson’s correlation. A test of Spearman’s rho is equivalent to a chi-square test on the ranks of the data.
Charles
good day…i just want to know if we can still use chi square if there are given only two variables…it goes like this…column one is the gender whether its male or female and then the folumn two is the level of IQ whther its above average ,average ,and below average…can we still used chi square for this problem…
Jerome,
No, but if you have rows represent gender (row 1 is male and row 2 is female) and you have columns represent IQ (column 1 is above average, column 2 is average and column 3 is above average), then you can use the chi-square test of independence.
Charles
can a co efficient of determination be calculated from a phi or cramers v
Sharon,
I don’t think so.
Charles
I want to learn how to compute making use of correlation and chi square
Jowe,
See Correlation
See Chi-square
Charles
Hi Charles,
Consider the following sample dataset. The following represent the count (number of occurrence of each category).
A = {889, 889, 3549, 1746, 2385, 3132, 5293, 1821, 1995, 1995}
B = {845, 845, 3372, 1659, 2266, 2975, 5028, 1730, 1895, 1895}
Is Chi Square Test result not impacted by
(a) scaling (multiplying all elements of Set A by a constant value 0.95 to get Set B as shown above)
(b) adding a constant value to all elements of Set A to get Set B
Pearson correlation and Cosine similarity also appear to invariant to scaling
Thanks.
For contingency tables used in the chi-square test for independence you need to have multiple rows and columns (not simply a string of numbers as in A), and so I am not sure how you want me to interpret the numbers in A. In any case, if I look at contingency tables, then the chi-square test is indeed impacted by multiplying all the columns by a constant or adding a constant to all the columns.
Charles
Hi Charles,
Thanks for the quick reply.
The scenario is: We performance test a website for an hour twice (Run A and Run B). The website has ten unique transactions (Tx 1 to Tx 10). The number in a cell denotes the count of execution of each transaction.
Both Run and Transaction are Nominal (categorical) attributes. The variations in counts between the two runs may be because of system performance etc.
Tx 1 Tx 2 Tx 3 Tx 4 Tx 5 Tx 6 Tx7 Tx8 Tx 9 Tx 10
Run A 1821 1995 1997 887 889 3549 1746 2383 3132 5291
Run B 1787 1854 1852 899 897 3589 1764 2424 3185 5384
The ChiSquare Test p value for Chi Square Test of Independence is 0.166 (accept at alpha of 0.05)
1) I need to check if there is a significant difference between the two runs with respect to the transactions executed. Is Chi Square Test of Independence suitable for this or Chi Square Test of Goodness of Fit (taking the proportions of Run A as the target)?
Tx 1 Tx 2 Tx 3 Tx 4 Tx 5 Tx 6 Tx7 Tx8 Tx 9 Tx 10
Run A 1821 1995 1997 887 889 3549 1746 2383 3132 5291
Run A’ 1787 1854 1852 899 897 3589 1764 2424 3185 5384
(A’ = 0.95A, this simulates a constant 95% reduction in count in Run B)
The ChiSquare Test p value is 1
Tx 1 Tx 2 Tx 3 Tx 4 Tx 5 Tx 6 Tx7 Tx8 Tx 9 Tx 10
Run A 1821 1995 1997 887 889 3549 1746 2383 3132 5291
Run A” 1638 1796 1796 799 799 3195 1571 2146 2818 4763
(A” = 0.90A, this simulates a constant 90% reduction in count in Run B)
The ChiSquare Test p value is 1
2) This implies the test results do not change when i multiply one dataset by a constant value. Is this understanding correct?
Tx 1 Tx 2 Tx 3 Tx 4 Tx 5 Tx 6 Tx7 Tx8 Tx 9 Tx 10
Run A 1821 1995 1997 887 889 3549 1746 2383 3132 5291
Run A+100 1638 1796 1796 799 799 3195 1571 2146 2818 4763
(this simulates a constant increase in count by 100 in Run B)
The ChiSquare Test p value is 0.716
3) This implies the test results change when i add one dataset by a constant value. Is this understanding correct?
Note: The Chi Square test in this site is not displaying the results. Have used most of the other tests and graph and they are working fine. An very useful website for researchers.
Thanks,
raghu
Raghu,
Sorry, but I still don’t understand the situation that you are describing. In any case, let me comment on whether the chi-square test result will change if you multiply by a constant or add a constant.
The following is a 2 x 2 contingency table. The p-value for the chi-square test of independence for this table is .93021
5..7
6..9
If I add 1 to the second row, I get the following contingency table. The p-value for this table is .97894
5..7
7..10
If I multiple the second row by 2, I get the following contingency table. The p-value for this table is .92081
5..7
12..18
As you can see, the p-values are all different.
Charles
hi Charles,
I want to ask you that i want to see that whether there exists a relation between my two variables or not. I’m a little confused about whether to use the correlation or chi square because one variable is ordinal and the other one is scale variable. hope to hear from you soon.
Thank you for the very useful tool. I noticed that Real Statistics gives Alpha=5 instead of 0.05 which results in NUM errors for the columns x-crit and sig in the CHI-SQARE table. Correcting the value of Alpha gives the right results.
Regards
Alex
Alex,
Unfortunately, this is a common problem with some versions of Excel where decimals are represented by 0,05 instead of 0.05. The software seems to work properly in some cases, but not in others. The good news is that you just need to enter the value you want in the dialog box (instead of using the default) and then the tool works properly.
Charles
Thanks for the prompt reply.
Hi Charles,
I would like to ask if the grand total must always be equal to the sample size? I have two variables age and symptoms and I need to test if these two are independent with each other. under symptoms i have backpain, itchyness, etc., and one respondent can chose more than one symptoms. the problem is when i make a contingency table its grand total will be higher than the sample size, is it okay that way? thanks!
Ara,
The grand total is equal to the sample size since each respondent can choose only one symptom. For your problem you can’t use the chi-square test of independence in the form described.
Charles