Objective
On this webpage, we describe the following:
- The relationship between the t-test and the correlation test
- Point biserial correlation
- The r-effect size (aka the eta or phi effect size)
Example
Example 2 of Two Sample t Test with Equal Variances tests whether memory recall is the same for the control group and the sleep-deprived group. The t-test is repeated in the middle part of Figure 1 based on the data for the two independent samples shown in ranges A4:A15 and A16:A27 of Figure 1.
This two-sample t-test can be turned into a correlation problem by combining the two samples into one sample (random valuable x) and setting the dichotomous random variable y to 0 for elements in one sample and to 1 for elements in the other sample. It turns out that the two-sample analysis using the t-test is equivalent to the analysis of the correlation coefficient using the t-test.
Example 1: Calculate the correlation coefficient r for x and y as described above, and then test the null hypothesis H0: ρ = 0.
The correlation coefficient is calculated to be r = 0.0214 (cell L5) and the correlation test is shown on the right side of Figure 1 using the approach described in Correlation Testing using a t-Test.

Figure 1 – Using correlation testing to solve Example 1
The p-values (cells H14 and L10) and t-statistics (cells F14 and L7) of the t-test and correlation test are exactly the same. Using either test, we conclude that the hay fever drug did not offer any significant improvement in driving results as compared to the control.
Point-biserial Correlation
Definition 1: A variable is dichotomous if it only takes two values (usually set to 0 and 1).
The point-biserial correlation coefficient is simply Pearson’s product-moment correlation coefficient where one or both of the variables are dichotomous.
Property 1: If {y1, …, yn} is a sample for the dichotomous random variable y and {x1, …, xn} is a sample for the random variable x, the point-biserial correlation coefficient between these samples can be expressed by the formula
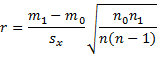
where m0 is the mean of the n0 data elements xi whose corresponding y value is yi = 0, m1 is the mean of the n1 data elements xi whose corresponding y value is yi = 1, and sx is the (sample) standard deviation of {x1, …, xn}.
If {x1, …, xn} and {y1, …, yn} are populations, then the point-biserial correlation coefficient is
![]()
where σx is the (population) standard deviation of {x1, …, xn}.
Proof: Click here.
Example 2: Calculate the correlation coefficient for Example 1 using Property 1.
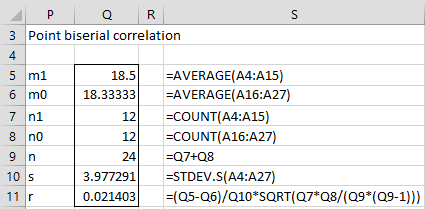
Figure 2 – Calculation of point biserial correlation coefficient
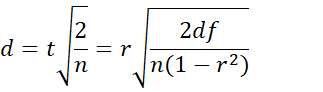
r-effect size
Property 2:
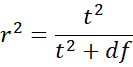
where t is the test statistic for two means hypothesis testing of variables x1 and x2 with t ~ T(df), x is a combination of x1 and x2, and y is the dichotomous variable as in Example 1.
Proof: Click here.
Example
The value for t from Example 1 is .1004. By Property 1,
![]()
and so r = .0214, which agrees with the value we get using the CORREL function (as we can see in cell L5 of Figure 1).
Effect size for comparing two means
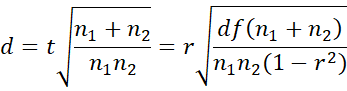
The effect size for the comparison of two means (see Two Sample t Test with Equal Variances) is given by
![]()
The sample version of this measure of effect size is
![]()
Using the formula from Property 1 of Correlation Testing via the t Test, we can convert this into an expression based on r as expressed in Property 3.
Property 3: Assuming the two populations have the same variance
Proof: Click here.
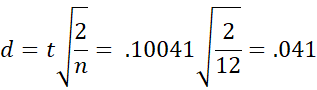
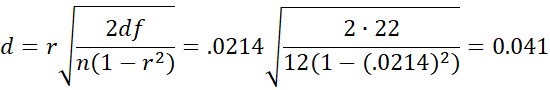
E.g., for the data in Example 1:
This means that the difference between the average memory recall score for the control group and the sleep-deprived group is only about 4.1% of the standard deviation. Note that this is the same effect size that was calculated in Example 2 of Two Sample t Test with Equal Variances.
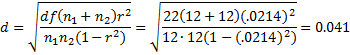
Equal sample sizes
If the sample sizes are equal with common value n, then Property 3 takes the form
For the data in Example 1:
Using Phi
Alternatively, we can use φ (phi) as a measure of effect size. Phi is nothing more than r. For this example φ = r = 0.0214. Since r2 = 0.00046, we know that only 0.046% of the variation in the memory recall scores is based on the amount of sleep.
A rough estimate of effect size is that r = .5 represents a large effect size (explains 25% of the variance), r = .3 represents a medium effect size (explains 9% of the variance), and r = .1 represents a small effect size (explains 1% of the variance).
One-sample and paired t-tests
When you only have one sample, you can’t create an equivalence between the t-test and the correlation coefficient as we did above. Despite this, we still can define the r effect size for the one-sample t-test (and similarly for the paired t-test) by using the formula in Property 2, namely
Examples Workbook
Click here to download the Excel workbook with the examples described on this webpage.
References
Wikipedia (2012) Point-biserial correlation coefficient
https://en.wikipedia.org/wiki/Point-biserial_correlation_coefficient
DATAtab (2024) Point-biserial correlation
https://datatab.net/tutorial/point-biserial-correlation
StatisticsLectures (2012) Effect size for dependent samples t-test
http://www.statisticslectures.com/topics/effectsizedependentsamplest/
Hi Charles
Could you give your opinion on this?
Let’s say I compared the distance run in 1 minute by men to distance run by women, and the results led me to reject the null-hypothesis. Would it be wrong to say that the gender correlates with the distance run? I used this phrasing in an essay, but my teacher disagrees, she says a t-test compares means and is not a correlation test.
Hello Linda,
Your teacher is correct that the usual two-sample t-test compares means, but as this webpage explains, this test is equivalent to one that tests whether a specific correlation is zero. For this latter test, it seems to me that “gender correlates with the distance run” is appropriate.
Charles
Hi, Charles!
The results of my paired sample t-test show that there is no significant difference between the two variables. Is it right not to proceed to the computation person-r given that the variables are not statistically significant?
Mitchel,
You can compute Pearson’s r, but the test for significance will yield the same result as the t-test.
Charles
Hello, Charles,
I am conducting an exploratory study for a dissertation investigating the extent to which two different types of Master’s programs include particular leadership skills in their curricula. Inclusion is measured by a 4 – point survey of faculty members. I used a t-test and found some significant differences between program type and skill inclusion. I then used a point biserial correlation analysis to verify, confirm or perhaps show different significance. I did find some differences. Is it a sound method to use both t tests and correlations?
Hello Robert,
As the webpage shows, the t-test and correlation test are equivalent, and so you should get the same result. If you are getting different results, then you are performing different tests from those described on this webpage.
Charles
Hello Charles,
I am trying to determine the correlation between two data sets of 20 samples each. The data sets use two different simulation methods (bulk method and detailed method) to generate radioactivity in fuel pins (the same pins are compared in each method). The results are close (% difference ranging from 0.5 – 1.5%) however, the bulk value is always slightly lower than the detailed. I tried running a paired t-test, but I was unable to select the null hypothesis because of the way the data appears. I have been looking through the tests on this site and I am unable to find a suitable one for my case. If you could point me in the right direction I would greatly appreciate it.
Braden
Hi Braden,
What hypothesis are you trying to test?
Charles
Thanks, Charles for this,
In my research, I tested whether there is a significant difference between two dependent variables by employing a paired sample t-test. The analysis shows a strong significant difference between these two variables. From this result, I intend to enhance my attribution of these findings by employing Pearson correlation. My question is, is that right, using correlation to enhance the findings of and interpretation of t-test?
Best
Hello Rahman,
What do you expect to gain by using correlation after the t-test?
Charles
Hi Charles,
If my hypothesis is about women being less likely to take risks than men, should i use the point biserial correlation test or independent samples t test? given that gender is a binary variable and the likelihood of taking risk is a continuous variable.
Cheers.
Elisa,
As this webpage demonstrates, the correlation test is equivalent to the t-test. Since the point biserial correlation is equivalent to the correlation coefficient when one of the variables takes only two values (such as gender), the two tests that you have referenced are equivalent.
Charles
Hi Charles
I am hoping you might be able to help me please.
I am trying to get my head round using SPSS to analyse the data I have.
I have worked out the correlation coefficient for the set of data, but now I want to see if there is a difference in the correlation score when I separate the data by gender.
I thought I could use the Split Data option within the SPSS V26 and then get 2 correlation scores (male & female) and see if they are different.
I have been told that this is incorrect, please would you be able to help me understand which test I should run in order to compare the correlation (by gender)?
I look forward to hearing from you and thank you very much for your help.
Best wishes
Juliet
Juliet,
I am sorry, but I don’t use SPSS and so I am unable to answer your question.
Charles
Hi Charles, if I am studying the grades for two different semesters what type of t-test should I use, and can I proceed to correlation after that?
Are they grades for the same students or different students?
Charles
Hi, if my question is “the association between the studying time and a test result”, and I’m having two set of data (time and result) from a same sample group. how the t test helps me to interpret the result? Thanks!
Hi Christine,
I presume that you are referring to a paired t test with null hypothesis that the mean of the difference between the studying time and test result is zero (i.e. the more you study the better the test results and the less you study the worse the test results. This is equivalent to a test of the correlation between studying time and test result.
Charles
Hi Charles.
Kindly help here. My research is on the stock exchange. My null hypothesis is using a Dividend discount model does not overvalued equity stock, the alternative hypothesis is it does over overvalue stock.
What statistical test would be best in testing the hypotheses?
I have the stock prices for all top 100 companies for 7 years each. I have also calculated their intrinsic value using the Discounted dividend model. I have means for both stock prices and the calculated prices.
Hello Santie,
If for each of the 100 companies, you had one value of stock price based on the dividend discount model and one stock value, then you could use the paired t-test.
If you have daily prices for 7 years, then the test to use would depend on you specify the null hypothesis.
Charles
How to solve? Kindly please help me. Thank you
n=35
r=0.8838
Perform seven steps significant test at α 0.05 level .
See https://real-statistics.com/correlation/one-sample-hypothesis-testing-correlation/
Charles
Given :
n=35
r=0.8838
(Q)Perform seven step significant test at α 0.005 level .
See https://real-statistics.com/correlation/one-sample-hypothesis-testing-correlation/
Charles
Hello sir,
Could you please help me in identifying the appropriate inferential tests for the following research questions:
1. Is there a statistically significant difference between the means of student enrollment rates in colleges before and after the Great Recession?
2. Is there a significant difference between the proportions of the race/ethnic groups for students enrolling before and after the Great Recession?
I assume that I should use paired sample t test for the first question (college enrollment rates before and after the crisis, it’s like a pre- and post test).
For the second question, I am totally confused between Chi square test and Pearson correlation coefficient.
Thank you.
Hello Jeedu,
For the first question, the answer depends on the type of data that you have. If you have the enrollment rate figures for a number of colleges before and after the Great Recession then a paired t test may be appropriate.
The answer is the same for the second question.
Charles
Good day sir, what kind of test should i use in my study? should it be a t-test or correlation?
my study is about:
Fiber Strength Evaluation of Two Plants According to their Location in in the plant.
i have 8 parameters:
plant height
girth of the plangs body(base, center, top)
number of leaves
fiber fresh weight
dry weight of fiber
fiber strength from the plant’s body (base, center, top)
Since you are probably comparing multiple parameters, neither test is likely to be appropriate.
In order to answer your question, first I need to know what hypothesis or hypotheses you want to test. The term “fiber strength according to their Location in the plant” is too vague.
Charles
Hello Good Evening Sir,
This is the scenario of the question –
A psychologist developed a new
Anxiety Inventory of 25 items. The
Cronbach alpha for the inventory was
found to be 0.80. The inventory was
administered to a group of 50 anxiety
disorder patients before beginning their
psychotherapy. The patients had a
significantly higher mean than the
normative group of normals. The same
group of patients was retested after 12
weeks of psychotherapy. The post-test
mean was significantly lesser than the
pre-test mean. The new Anxiety Inventory
was correlated with an established anxiety
inventory and the correlation turned out to
be 0.20. The norms of the inventory were
developed in terms of normalized T scores.
My question is –
What would be the median T score
for the new Anxiety Inventory?
Hello Shipu,
How do you define the normalized t score? Did to try to calculate this using your data?
Charles
No sir, I didn’t understand that how I can calculate median T score through this given data. Can you explain me how I can solve this problem?
I don’t know what you mean by a “t-score”. Do you mean the t statistic?
Charles
Hello,
I have a question regarding the topic. I have the variable A (scale) with which I create 3 groups (using the mean and Std., Value mean+Std. the highest one, and values inbetween the middle one).
I would like to see if the lowest group has a different score on variable B (which only is a 10 degree Likert-scale) than the highest group or not. Can I do this, or should I run a Spearman correlation analysis between the two variables? Or should I run both tests to emphasize the results?
Thanks in advance.
Sorry Gabor, but I don’t understand the scenario that you are describing. You should be able to use a t test provided the data is normally distributed. Otherwise, you could use a Mann-Whitney test.
Charles
Good evening Sir, I have a question that I want to ask. I am looking for a relationship between one independent variable with three levels and one dependent variable, which statistical tool am I going to use for this.
The hypothesis that I want to test is;
There is no significant relationship between the availability of laboratory equipment and academic performance.
The availability has three levels which are adequate, inadequate and not available.
I would be glad to hear from you sir 🙏
It seems like a fit for one-way ANOVA, but it also depends on the nature of your data.
Charles
Ok, thank you.
In my case sir I have a sample of 27 schools, where I want to find out the relationship between availability of laboratory equipment and academic performance. Two instruments were used for data collection, one of the instrument was a questionnaire for the level of availability, and the other was a performance test that has a total of 25marks.
The study found out that 4 schools have adequate equipments, 21 schools have inadequate equipments and there were no equipments at all in 2 schools. I calculated the mean test score of each school, for the availability I assigned 3 to school with adequate equipment, 2 to school with inadequate equipments and 1 to school without equipments.
My x variable was the level of availability in each school, and my y variable was the mean score of the school. Example below
X. Y
3. 13
2. 16
3. 17
1. 10
2. 9
After which ppmc was used to correlate the data. Sir is my analysis correct or is there any approach I can use apart from this one. Thank you
You can certainly calculate a correlation coefficient for X vs Y. How do you plan to use the result?
Charles
The result is going to be used to conclude whether a significant relationship exists between the level of availability and academic performance of students. It is one of my dissertation research hypothesis that I want to test.
In that case, you will want to test the correlation coefficient. See
One Sample Testing of Correlation
pls help me out here.
Construct a test of four items.Assess the reliability of the test by administering it to four persons at different point or interval.compute the coefficient of correlation if the test.help out dnt know how to go about it
Hello Faith,
I don’t understand the approach you are defining, but the following webpage describes many approaches to measuring reliability
Reliability
Charles
Basing from the Example 2 where there were two groups (one taking the drug and the other one is not) converted to 0 and 1 in this Example 1, the groups were initially the IV for the t test statistics. But in this example, it is the y (or the DV). Will it matter if I retain the 0 and 1 as the x for correlation test, or it is required to use the dichotomous variable as the y? Thank you!
Hi Mel,
Since CORREL(A,B) is the same as CORREL(B,A) if I understand your question correctly, it won’t matter.
Charles
An observation to check the math:
φ = r = 0.0214. Since r2 = 0.00046, we know that 0.46%. Should it be 0.046%?
I may not be understanding the derivation. Thanks for such a transparent teaching website.
Winston,
Yes, the value should be 0.046%. Thanks for catching this typo. I have corrected the webpage to reflect the correct value.
I appreciate your help in improving the accuracy of the Real Statistics website.
Charles
Dear Charles:
Is it OK if I use this test on Spearman correlation coefficients?
Thanks in advance,
Jorge
Jorge,
I don’t understand your question. Which test do you want to use on Spearman’s correlation?
Charles
Can we make correlation in one sample t test
Wajid,
I don’t completely understand your question. Perhaps the following webpage addresses your issue:
One Sample Hypothesis Test for Correlation
Charles
Can anyone tell me the formula for a t-test for the difference between two mean using the Pearson Product Moment Correlation Coefficient instead of calculating difference scores?
William,
This is exactly what is shown in Example 1.
Charles
Dear Dr. Zaiontz,
I have two observer that had (independently) measured the area of cartilage of a group of patients. I want to compare these measures (that are normally distribuited) saying that the two can overlap. Can I run an unpaired t-test? or a correlation coefficient using t-test?
Thank you for creating this website, it’s very easy to understand and also to use,
Sincerely
Laura
Laura,
Sorry, but I don’t understand what you mean by “the two can overlap”.
What hypothesis do you want to test?
Charles
What I would like to say is that there is no statistical difference between measures made by observer 1 and those made by observer 2, so that the two groups of measures are very close to each other.
Thank you so much,
Laura
Hi,
Please advice how can I interpret the following:
when matched pair t-test shows insignificant difference but Pearson’s correlation gives significant difference. Please advice how to compare this result
Shanta,
The matched paired t test is different from the two independent sample t test, but the latter is equivalent to a test of Pearson’s correlation (as explained on the referenced webpage).
Charles
I am doing a study that looks at the relationship between father participation in school activities (0, 1) and change in their children’s test scores (spring to spring). If I use a t-test to calculate the difference of the means of the change in scores by group and I find that the difference is significant, should I also talk about the slope of the regression line or the correlation coefficient to get a sense of the nature of the relationship or R squared? How would I get that number?
Imcafee,
I am not sure what extra information you would get by doing this, but as the referenced webpage explains, you can turn a t test into a correlation by using a dummy dichotomous variable. Once you calculate the correlation coefficient in this way, R-square is just the square of the correlation coefficient.
Charles
r(x, y) t p
-0.78 -3.29 0.01
-0.28 -0.86 0.41
-1.00
pls help me in interpreting this result…correlation of two variables.thanks
The first row calculates a sample correlation coefficient of -.78 and shows that the population correlation coefficient is significantly different from zero with 99% confidence
The second row calculates a sample correlation coefficient of -.28 and cannot reject the null hypothesis that the population correlation coefficient is zero
The third row calculates a sample correlation coefficient of -1, which means that the two samples are 100% negatively correlated
Charles
r (Correlation) t comp Tabled t Comparison Decision
0.12 0.99 1.996 less than ?
How to interpret this table? Kindly please help me. Thank you
Sorry, but I don’t know what you are referring to.
Charles
I have a question.
I have two variables out of which one is continuous and the other is (artificially) dichotomous with an underlying property being continuous and normally distributed.
I want to find the correlation coefficient between these two variables. which will be better Point Biserial or Biserial coeff?
May i ask a qn? Who is Charles Zaiontz?
See Author.
Charles
Can I ask for help? Here is the data given aside from there means.
ΣX2 = Sum of square First Scores
ΣY2 = Sum of square Second Scores.
Can I ask for help? Suppose I have the data for means of x and y then their summation of squared value only, how can i compute if they are significantly different at 5% level of significance. Thank you.
Charisa,
When you say that you want to “compute if they are significantly different”, are you referring to the means of x and y or something related to the correlation between x and y (in which case, the usual test is whether the correlation is significantly different from zero)?
Charles
Thank you so much for this helpful explanation and the worksheet. However, in the downloadable worksheet, instead of ‘sig’ the cell value will be called ‘reject’, which to me sounds like the exact opposite. Am I missing something?
Kind regards and many thanks, Christian.
Christian,
“Reject” in this context means “reject the null hypothesis,” which is equivalent to a significant result. Also, it seems that you are referring to an old version of the examples worksheet. The latest version uses “sig” instead of “reject”.
Charles
So, I can use any one I wish since they are the same
Yes, you can use either one since they are equivalent tests.
Charles