Basic Concepts
Definition 1: The probability density function (pdf) of the normal distribution is defined as:
![]()
Here, the constant e = 2.7183…, and the constant π = 3.1415… which are described in Built-in Excel Functions.
The normal distribution is completely determined by the parameters µ and σ. It turns out that µ is the mean of the normal distribution and σ is the standard deviation. We use either the abbreviation N(µ,σ) or N(µ,σ2) to refer to a normal distribution with mean µ and standard deviation σ (or variance σ2).
We will also use the notation x ∼ N(µ,σ) or x ∼ N(µ,σ2) to mean that x is a random variable with mean µ and standard deviation σ (or variance σ2).
As we shall see throughout the website, the normal distribution occurs frequently and is very useful in statistics.
Worksheet Functions
Excel Functions: Excel provides the following functions regarding the normal distribution:
NORM.DIST(x, μ, σ, cum) = the probability density function value f(x) for the normal distribution N(μ, σ2) when cum = FALSE and the corresponding cumulative distribution function F(x) when cum = TRUE
NORM.INV(p, μ, σ) = the value x such that NORM.DIST(x, μ, σ, TRUE) = p; i.e. the inverse of NORM.DIST(x, μ, σ, TRUE)
These functions are not available for versions of Excel before Excel 2010. For earlier versions of Excel, the following functions are used: NORMDIST, which is equivalent to NORM.DIST, and NORMINV, which is equivalent to NORM.INV.
Chart
Example 1: Create a graph of the distribution of IQ scores using the Stanford-Binet scale.
This distribution is known to be the normal distribution N(100, 256), where 256 is the variance (and so the standard deviation is 16). To create the graph, we first insert the values x = 50, 51, …, 150 in range A4:A104 of Figure 1 and then add the corresponding f(x) values in column B. This is done by first inserting the value 50 in cell A4, the formula =A4+1 in cell A5, and then highlighting the range A5:A104 and pressing the key sequence Ctrl-D. Next, insert the formula =NORM.DIST(A4,100,16,FALSE) in cell B4, highlight the range B4:B104, and press Ctrl-D.
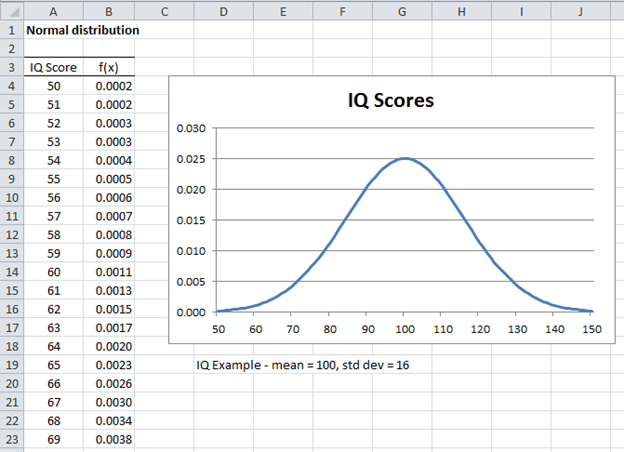
Figure 1 – Probability density function for IQ
You can draw the chart of the probability density curve, as shown on the right side of Figure 1, by highlighting the range B4:B104, selecting Insert > Charts|Line, and then making the formatting changes as described in Line Charts. As you can see from the figure, the curve has the characteristic bell shape of the normal distribution.
Basic Properties
As can be seen from Figure 1, the area under the curve to the right of 100 is equal to the area under the curve to the left of 100; this makes 100 the mean. Since the normal curve is symmetric about the mean, it follows that the median is also 100. Since the curve reaches its highest point at 100, it follows that the mode is also 100.
Key properties of the normal distribution are as follows:
- Mean = median = mode = µ
- Standard deviation = σ
- Skewness = kurtosis = 0
The function is symmetric about the mean with inflection points (i.e. the points where the curve changes from concave up to concave down or from concave down to concave up) at x = μ ± σ.
As can be seen from Figure 2, the area under the curve in the interval μ – σ < x < μ + σ is approximately 68.26% of the total area under the curve. The area under the curve in the interval μ – 2σ < x < μ + 2σ is approximately 95.44% of the total area under the curve, and the area under the curve in the interval μ – 3σ < x < μ + 3σ is approximately 99.74% of the area under the curve.

Figure 2 – Areas under a normal curve
Given the symmetry of the curve, this means that the area under the curve for x > μ + σ is 15.87%, i.e. (100% – 68.26%) / 2. The area under the curve for x > μ + 2σ is 2.28% and the area under the curve for x > μ + 3σ is 0.13%.
It also turns out that 95% of the area under the curve is in the interval -1.96 < x < 1.96. This will be important when considering the critical value for α = .05.
Additional Properties
Property 1: If x has a normal distribution N(μ,σ), then the linear transform y = ax + b, where a and b are constants, has a normal distribution N(aμ+b, aσ).
Property 2: If x1 and x2 are independent random variables, and x1 has normal distribution N(μ1,σ1) and x2 has normal distribution N(μ2, σ2) then x1 + x2 has normal distribution N(μ1+μ2, σ) where
![]()
Click here for additional characteristics of the normal distribution function (using calculus), as well as proofs of Properties 1 and 2.
Example
Example 2: A charity group prepares sandwiches for the poor. The weights of the sandwiches are distributed normally with a mean of 150 grams and a standard deviation of 25 grams. One sandwich is chosen at random (this is a random sample of size one). What is the probability that this sandwich will weigh between 145 and 155 grams?
NORM.DIST(145, 150, 25, TRUE) = .42074 = probability that weight is less than 145 grams
NORM.DIST(155, 150, 25, TRUE) = .57926 = probability that weight is less than 155 grams
The requested probability is therefore .57926 – . 42074 = .15852 = 15.85%.
Links
Examples Workbook
Click here to download the Excel workbook with the examples described on this webpage.
References
Wikipedia (2013) Normal distribution
https://en.wikipedia.org/wiki/Normal_distribution
Schmuller, J. (2009) Statistical analysis with Excel for dummies 2nd Ed. Wiley Publishing
To compute property-2 in Excel
Is Norm.dist ( x1+x2; mu1+mu2; sqrt(rho1^2+rho2^2); True) correct ?
It looks correct, assuming that you want to calculate the cdf. Also, rho is usually expressed as sigma.
Charles
For a numeric lottery with a history of several hundred draws, each number has an Avrg and Stdv of the trials intervals between each presence with a Normal distribution pattern.
Before a next draw, a number has x trials since its last presence.
To assess the probability of a presence in a next draw: May I use
Norm.dist ( x+1; avrg, stdv;True) – Norm.dist (x; avrg; stdv;True)
Or, would Norm.dist(x+2; avrg; stdv;True) – Norm.dist(x+1; avrg; stdv; True) better ?
Please advise
Hello Pierre,
For any number m that can come up in the lottery, does x represent the number of draws since the number m has last been drawn? Thus if say the numbers that can be drawn are 1, 2, …, 30, then you actually have 30 random variables, one for each of the 30 numbers. Is this correct? Also, is only one number drawn on each day or are multiple numbers (say 5) drawn each day? E.g. if on day 1, the numbers 1,5,16,29,30 are drawn and then on day 2 the numbers 2,3,5,11,22 are drawn, is 1 the value for the random variable x associated with the number 5? Here 1 represents one day. Or is the value 6 (namely 5 is drawn after the 6 values 16, 29, 30, 1, 2, 5)?
Finally, are the values avrg and stdv known or are you trying to estimate these from the data? Are avrg and stdv different for each of the possible lottery numbers?
Charles
As of the last of 400 draw, each of the 50 balls has cumulated its own Avrg and Stdv of trial intervals between each presence.
Each balls have a number of trials since its last presence in previous draws
In my Norm.dist (x; avrg, stdv True) x = number of trials since a previous presence.
x=0 when a ball is present is a draw
As of the last draw; 1 of the balls has; cumulated trials x = 6 since its last presence; Avrg (trials) = 8.794; Stdv (trials) = 8.557 from 400 draws
To assess the probability of a presence of this ball in a next draw; I use Excel statistical formulas, and insights from your pages.
I compute N(x+2) – N(x))/2 as an average value in the probability space under the bell curve of this ball between these two points = 0.046. Each ball have its own bell curve.
The Stdv of (N(x+2)-N(x+1); (N(x+1)-N(x)) is 0.000378
8 of 50 balls are drawn in each draw of this lottery.
Hello Pierre,
If x = the number of trials since a previous presence, then why do you think that this variable has a normal distribution? I suggest that you create a histogram to see whether this is likely.
1. I suggest first that you start out with a simpler problem by focusing on one ball. You can use data that you have or generate random draws using a random number generator. E.g. suppose you make 400 draws from say 6 balls (1,2,3,4,5,6) and you want to see the value of x for the ball labeled 1. You can make one draw using the formula =RANDBETWEEN(1,6). Now place this formula in cell A2 and highlight the range A2:A401 and press Ctrl-D. Next, press Ctrl-C and then perform Paste Values. Column A now contains a (non-volatile) sequence of 400 random values between 1 and 6. Now, place the value 0 in cell B1 and the formula =IF(A2=1,0,B1+1) in cell B2. Finally, highlight the range B2:B401 and press Ctrl-D. Range B2:B401 now contains a random set of values for x.
You can now draw a histogram (e.g. using the Real Statistics Histogram data analysis tool). You will see that this does not resemble a normal distribution.
2. I also tried to create a histogram for the problem that you are working on, except that once again I restricted myself to 6 balls. The simulation is a little more complicated to create, but also I observed that this histogram does not resemble a normal distribution.
3. I chose 6 balls since this is the number of faces on a die and so I have recreated your problem but for throws of one die. In fact, it might be useful to look at Example 2 on the following webpage
Geometric Distribution Examples
Charles
Thank you,
Testing your example and your advice. For each balls, the trial intervals between each presence are not in a Norm.dist pattern, but a weird curve.
Reconfiguring my whole Excel worksheet with the same objective: to harvest several numbers that can be used to compose un-drawned combinations in future draws.
Your insights, teachings and tools offered in these pages are highly useful.
Pierre,
Thanks for your kind remarks.
I will send you an Excel spreadsheet that carries out the simulation based on several numbers.
Charles
Addendum to my last post
I’m not trying to determine if a specific combination is a possible winner.
I’m trying to filter out numbers that may become playable combinations in a next draw.
The simplest way to explain my process would be to send you my Excel worksheet ( about 400Mb ) to either one of your e-mail address. For your review and comments at your convenience. You may also test it for any other lottery you are familiar with.
Addendum-2; Correction on the size of my Excel worksheet = 400Kb.
Hi,
I think the kurtosis value must be 3 for a normal distribution. Kindly verify.
Yes, you are correct, but then 3 is subtracted from value of the kurtosis to get the value of zero for a normal distribution.
Charles
In N(x) = Norm.dist (x; avrg; stdv; True): If “True” = integral of the formula from -00 to x = the value of the area under the curve from -00 to x; May I use 1 – N(x) to calculate this values from x to +00 ?
Yes, since the normal distribution is symmetric around the origin.
Charles
In summary, what can we say are the exact values (as in zero or one) of mean, median, mode and standard deviation in standard normal distribution curve
James,
mean, median and mode are zero
standard deviation is one.
Charles
Hi Charles,
I might be wrong , but i how do you calculate std as 16. i calculated 29.15475947 for population and 29.30017065 for sample ? can you tell me how did you get value 16.
And when i populate chart on on stddev 29.30017065 then it is not normal bell curved.
Keshav,
The value of 16 is not calculated. It is an assumption of the population standard deviation. This value won’t necessarily be equal to any value you calculate using STDEV.P or STDEV.S.
Charles
Hi Charles,
few questions:
1. RE your example of the IQ score — Why did you use the standard deviation of 16 instead of the actual value 29.3?
2. I’ve seen many examples where the analysts use the median rank instead of using the excel function Normdist(x, mean, standard deviation, true) for cummulative probability. Why is this?
Tony,
1. If you are referring to Example 1, then I used 16 since that is the population standard deviation for the IQ test.
2. Sorry, but I don’t know what median rank you are referring to?
Charles
Charles, thx for your reply and below is clarification on my previous questions.
1. yes I was referring to your Example1 (IQ test). Using excel formula stdev (50,51,52,…150) produces the standard deviation of 29.3 and not 16 as you used.
2. Cumulative F(x) is calculated by using the median ranking (i-0.3)/(n+0.4), where n=total sample size and i=the rank position of the sample. For example, if n=20, then F(x) of the first sample would be (1-0.3)/(20+0.4) and the last sample F(x)=(20-0.3)/(20+0.4). The cumulative is calculated this way for each sample instead of using the excel normdist(x, mean, stdev, 1).
thanks in advance for your inputs.
Tony,
1. I drew the chart for the population distribution which has a known standard deviation of 16. I am not trying to fit the data to a normal distribution. I could have added values 40, 41, 42, 43, 44, 45, 46, 47, 48, 49 and 151, 152, etc. and the chart would look more or less the same. The values 50, 51, …, 150 are not to be considered to be sample values — there is no sample here; they are merely x values where I am plotting x,y on the chart.
2. Again, the approach you are referring to is used to fit the data to a normal distribution (as is done to create a QQ plot). This is not what I was doing. I was simply plotting (x,y) values where y = f(x) and the function f is the pdf of the normal distribution.
Charles
oh great
NORMDIST(145, 150, 25, TRUE) = .42074 = probability that weight is less than 145 grams
I’m sorry, but is that probability that weight is less than 145 grams, or probability that weight is less than or equal to 145 grams?
Vladimar,
Since for a continuous distribution (such as the normal distribution) the probability of any specific value x is zero, either interpretation is accurate (i.e. you can use “probability that weight is less than 145 grams” or “probability that weight is less thanor equal to 145 grams”)
Charles
Thanks Charles, I really benefit from this wishing you all the best
thanks charles for you good additional information am benefiting from.
please try to write the basic main uses and properties of normla ditribution, binomial distribution and poisson distribution 🙂
The main uses and properties of the normal distribution are described throughout the website. The main uses and properties of the binomial distribution are described on the webpage Binomial Distribution. Those of the Poisson Distribution on the webpage Poisson Distribution.
Charles
from kenya av learnent alot
Charles,
Thanks for explaining your logic. The inconsistency between usual theory and Excel practicaility could perhaps be reconciled by writing it as N(100,16^2) rather than
N(100,256) or N(100,16) ?. (though with a neater squared symbol than ^2)
Great site by the way !
Simon
In other places, including my course notes and Wikipedia, normal distribution is represented by N(mu,sigma squared), such that the second parameter is the variance. In your example, in N(100,16), the 16 is the standard deviation as illustrated by the graph. Have you used a different interpretation and is this the case through all your pages ?
Simon,
I have indeed used the standard deviation instead of the variance as the second parameter. I have done this consistently throughout the website.
I chose to use the standard deviation because Excel’s formula NORMDIST(x, mean, stdev, cum) uses the standard deviation. In some sense it is also simpler. The problem with this approach occurs when you look at the multivariate normal distribution, where the second parameter is the covariance matrix, which is really a multivariate version of the variance and not the standard deviation. For this reason, the variance might have been a better choice.
Charles
Hi Charles, Thanks for putting together this really useful and very well put together
website. I think this is an error-
In the few lines below figure 3, the left area of the curve is missing i.e. it only says x> sigma but should x > μ + σ or x < μ + σ is 15.87%, i.e. (100% – 68.26%) / 2.
Also, is should be 15.87 instead of 16.13 and for 2σ and σ sigma values.
Thanks!
Kabir,
Good catch. You are 100% correct that the value should be 15.87%. I have just changed the webpage to reflect this. Thanks for finding this error.
Regarding left area of the curve being missing, I don’t see this. With my browser (Crome) the complete curve is displayed. I don’t reference the left area of the curve since it is the same as the right).
Charles
a bit confused … when you have a set of data do you first find the average and std deviation of that data and then try and approximate it with a probability distribution and use this for your analysis?
how do you know that the data can be represented by a normal distribution?
Paul,
On the referenced webpage, we are assuming that we already know that the normal distribution with a given mean and std dev is a suitable model.
In general a number of popular statistical tests will assume that the data can be represented by a normal distribution. You can then test whether this assumption is true as described on the webpage https://real-statistics.com/tests-normality-and-symmetry/. If this assumption is not true, you will need to find a different test for which the assumptions are met, or use one of the non-parametric tests as described on the webpage https://real-statistics.com/non-parametric-tests/.
Charles
the material is very helpfull for my studies as iam doing my BBA. please keep it up.