Basic Concepts
Definition 1: The standard normal distribution is N(0, 1).
To convert a random variable x with normal distribution N(μ, σ2) to standard normal form use the following linear transformation:
![]()
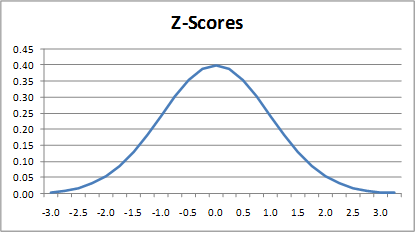
The resulting random variable is called a z-score. Thus z = STANDARDIZE(x, μ, σ), as described in Definition 3 and Excel Functions in Expectation. Figure 1 displays the graph of the standard normal distribution.

Figure 1 – Standard normal curve
The z-score provides a standard way to compare statistics based on different normal distributions.
Property
Property 1: If x is a random variable with normal distribution N(μ, σ) then the corresponding z-score has normal distribution N(0, 1)
Proof: Since is a linear transformation of the form
by Property 1 of Characteristics of Normal Distribution, it follows that z has the normal distribution
![]()
Worksheet Functions
Excel Functions: Excel provides the following functions for the standard normal distribution:
NORM.S.DIST(x, cum) = NORM.DIST(x, 0, 1, cum); the standard normal version of NORM.DIST
NORM.S.INV(p) = NORM.INV(p, 0, 1)
Note that NORM.S.INV(p) = the value x such that NORM.S.DIST(x, TRUE) = p.
These functions are not available for versions of Excel prior to Excel 2010. For such versions of Excel, the following functions are available: NORMSDIST(x) which is equivalent to NORM.S.DIST(x, TRUE), and NORMSINV which is equivalent to NORM.S.INV.
Examples Workbook
Click here to download the Excel workbook with the examples described on this webpage.
Reference
Wikipedia (2013) Normal distribution
https://en.wikipedia.org/wiki/Normal_distribution
Hi, Dr. Charles.
A dumb question: Why would I convert a random variable x with normal distribution N(μ, σ) to standard normal form? Can you give me a practical example?
My best regards
Hello Cesar,
It depends on what you mean by a practical example. You never absolutely need to convert normally distributed data to standard normal form, but you can always do so. It is often easier to do certain tests using z-scores (i.e. the data transformed to standard normal format), but this again is not strictly necessary. If you want to compare values from two different normal distributions, it can be useful to find the z-scores of each and compare these.
Charles
Dear Dr. Charles,
I want to know what is the limit on the amount of data for a normality test, I have a base of 220,000 data and an error appears when performing it.
Hello Felipe,
For some situations there is an Excel limitation of 65,535, but this isn’t always the case. I suggest that you try again using 64,000 and see whether it works and then again with 70,000. If 70,000 works then I would guess that 220,000 should also work (provided there isn’t an error value in the data).
Charles
I estimate a project to cost $10 000. Under favourable conditions, the lowest possible cost would be $6 000; and if all the risks materialise, then it would cost as much as $20 000. Statical variations will take on a Beta Distribution. What is the most likely cost of this project?
Hello Heather,
If $6,000 represents an estimate of the mean of this distribution, then the most likely cost would be $6,000. Now if you want a confidence interval for this this value, then you would likely need to use some properties about the beta distribution. Why do you believe that the data follows a beta distribution? Do you have any idea what the parameters are from this distribution?
Charles
Dear Dr. Charles,
I have a data collected. Do I need to standardize first before I construct a histogram to test for normality?
Chloe,
No you don’t need to standardize before constructing a histogram or testing for normality.
Charles
Hi Charles!
Your site is very helpful. Thankx for the reply on ANOVA. I have confusion regarding normal distribution of data.
If i collect data from 10 sites (10 replicates each), if i have to check the normal distribution of the data , i check for each site separately or overall data i.e all 10 sites together, or
for an experiment (treatment v control) and with 6 replicates, the normality of the data, is checked for the control and treatment separately, or both together.
Thankx!
Sanitha,
You need to check the normality of each group separately.
Charles
Thankx! Charles.
Dear Dr. Charles,
Thank you for your helpful website.