On this webpage, we provide tables describing built-in Excel worksheet functions that are particularly useful for statistical analysis. Also, see Conditional Excel Functions, Table Lookup Functions, and Excel Statistics Functions.
Basic mathematical functions

Figure 1 – Basic mathematical functions
Some properties of EXP and LN (see also Exponentials and Logs):

Figure 2 – Log and Exp properties
Combinatorial functions

Figure 3 – Combinatorial functions
Note that FACT(n) produces a value for n up to 170. For values higher than 170 an error value is returned. COMBIN(2*n, n) yields a value for n up to 514. PERMUT(2*n, n) produces a value for n up to 134.
Rounding functions
 Figure 4 – Rounding functions
INT(x) = TRUNC(x, 0) when x ≥ 0 or x is an integer and INT(x) = TRUNC(x, 0) – 1 otherwise.
Integer functions
 Figure 5 – Integer-valued functions
Note that INT(x) = TRUNC(x, 0) when x ≥ 0 and INT(x) = TRUNC(x, 0) – 1 when x < 0.
Random number functions
 Figure 6 – Random number functions
The random numbers generated change every time the cell containing the function is regenerated. To generate a random number value that does not change, enter RAND(), or an expression containing RAND(), and then press the function key F9 followed by Enter.
Sum and related functions
For the examples in Figure 7, let R1 = {4, 6, 7, -3}, R2 = {6, 8, -5, 7}, R3 = {5, “”, “A”, 6, -1}

Figure 7 – Sum and related functions
You can also make a count of the unique elements in a data range in Excel. The following array formula counts the number of unique values in range R1 (see below for information about COUNTIF).
=SUM(1/COUNTIF(R1,R1))
The only problem with this formula is that an error results if R1 contains an empty cell. To correct this, you can use the following array formula:
=SUM((R1<>””)/COUNTIF(R1,R1&””))
If you replace SUM by SUMPRODUCT then the result is an ordinary formula, and not an array formula, and so you only need to press Enter not Ctrl-Shft-Enter.
To count the number of unique numeric cells in range R1 you can use the following array formula:
=SUM(IF(FREQUENCY(R1,R1)>0,1))
Once again if you replace SUM with SUMPRODUCT the result is an ordinary formula. In fact when SUMPRODUCT has only one argument then it is equivalent to SUM even when used in array formulas. The reason that these formulas give the desired results is a bit complicated and depends on how Excel treats array formulas, and so it is not necessary for our purposes to go into this further.
The Real Statistics Resource Pack provides the function COUNTU(R1) which counts the number of unique numeric cells in range R1 and COUNTAU(R1) which counts the number of unique cells in range R1 (see Real Statistics Reformatting Functions).
Figure 8 contains some examples of how these formulas are used.
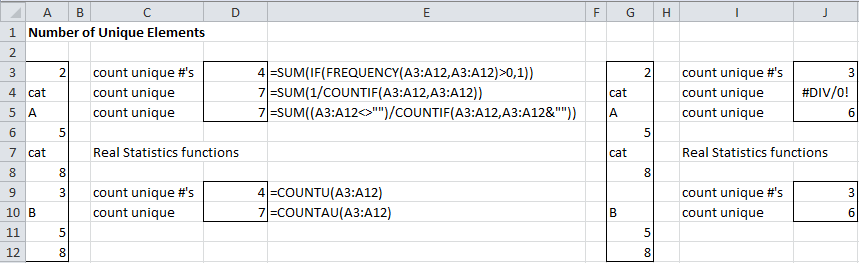
Figure 8 – Count of the unique elements in a range
Matrix functions
Excel supports the following matrix functions. These functions are covered in more detail in Matrices and Iterative Procedures.

Figure 9 – Matrix functions
Excel 2013 introduced the array function MUNIT(n) which returns the n × n identity matrix. Users of previous versions of Excel can use the Real Statistics array function IDENTITY(n) instead. The Real Statistic Resource Pack also provides the MPROD array function where MPROD(R1, R2, R3) = MMULT(R1, MMULT(R2, R3)) and MPROD(R1, R2, R3, R4) = MMULT(MMULT(R1, R2), MMULT(R3, R4)).
Dynamic Array functions
The functions in Figure 10 are only available to Excel 2021 and Excel 365 users.

Figure 10 – Dynamic array functions
In addition, the functions shown in Figure 11 are available to Excel 365 users. See Excel Reformatting Functions for more information.
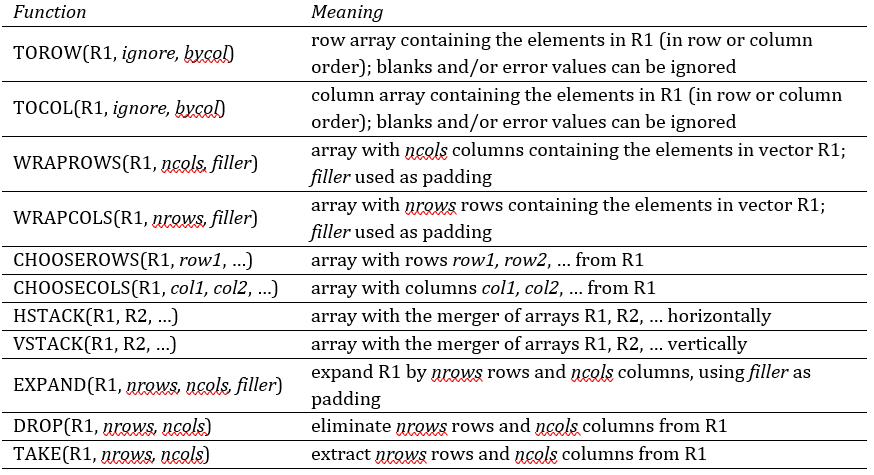
Figure 11 – Reformatting functions
LAMBDA-based functions
The functions in Figure 12 are only available to Excel 365 users.

Figure 12 – LAMBDA-based functions
Examples Workbook
Click here to download the Excel workbook with the examples described on this webpage.
Reference
Microsoft (2021) Excel functions
https://support.microsoft.com/en-us/office/excel-functions-alphabetical-b3944572-255d-4efb-bb96-c6d90033e188#bm19
Dear Doc Zaoinitz, there are elementary error, in the table Sum and related functions, in the function count, you have (R1), and really is R3.
Thanks a lot for your page
Hello Gerardo,
I assume that you are referring to Figure 7. I don’t see the error. Can you help me find which part of the table has an error?
Charles
I have been given this table for Chi distribution. No one can find the formula in Excel for it.
degrees of area to the right of the critical value
freedom .995 .99 .975 .95 .9
2 .010 .020 .051 .103 .211
It goes on; this is just a sample.
Diane,
The Excel formula for the chi-square distribution is CHISQ.DIST or CHISQ.DIST.RT. The critical values are calculated using the formula CHISQ.INV or CHISQ.INV.RT.
Charles
The statements in Column I of rows 2 and 3 of Figure 8 should be:
=SUMIF($B$2:$B$9,$E2,$C$2:$C$9)
=SUMIF($B$2:$B$9,$E3,$C$2:$C$9)
The current statements do not account for the data labels
Hi Kevin,
Thanks for bringing this error to my attention. I have now made your suggested changes. I appreciate your help in improving the website.
Charles
Hello Charles,
I have #name errors for all of the custom functions. I get no response from entering VER or using cntrl M. What am I missing?
Hello William,
This seems to mean that you haven’t installed the software. You need to follow the installation instructions on the webpage from which you downloaded the Real Statistics software.
Charles
Good day Sir,
I install XRealStats.xlam in my Windows 10 office 2019 but is not working i cannot find it in the Excel tab. i have tried all my possible best but not just working sir.
Hello Alexander,
What do you see when you enter the formula =VER() in any cell?
What do you see when you press the key sequence Ctrl-m ?
Charles
how to write 25i in complex
Anu,
In Excel 25i is written as “0+25i”. See the following webpage for more details>
https://real-statistics.com/other-mathematical-topics/complex-numbers/
Charles
Hi
Can you have a function inside of a formula? If so are there any examples?
Hi Jody,
Yes. There are many examples on the website. E.g. =AVERAGE(ABS(A1:A40)), the mean of the absolute values of the data elements in range A1:A40. Or =SUM(A1:A4)+1, one more than the sum of the elements in the range A1:A4.
Charles
Can someone tell me how to get the probability that three quotes are within x number of each other?
Thank you
Raza,
You need to supply additional information. E.g. is there a lower and upper limit for how big a quote can be? Do the quotes follow some distribution?
Charles