Objective
As seen in Linear Regression Models for Comparing Means, categorical variables can often be used in regression analysis by first replacing categorical variables with a dummy variable (also called a tag variable).
We now illustrate more complex examples and show how to perform One Factor and Two Factor ANOVA using multiple regression. See Three Factor ANOVA using Regression for information about how to apply these techniques to factorial ANOVA with more than two factors.
One-way ANOVA
We start with a One Factor ANOVA example.
Example 1: Repeat the analysis from Example 1 of Basic Concepts for ANOVA with the sample data on the left side of Figure 1 using multiple regression.

Figure 1 – Using dummy variables for One-way ANOVA
Our objective is to determine whether there is a significant difference between the three flavorings. In this example, we have reduced the sample size from Example 1 of Basic Concepts for ANOVA to better illustrate the key concepts. Instead of doing the analysis using ANOVA as we did there, this time we will use regression analysis instead. First, we define the following two dummy variables and map the original data into the model on the right side of Figure 1.
t1 = 1 if flavoring 1 is used; = 0 otherwise
t2 = 1 if flavoring 2 is used; = 0 otherwise
Note that in general, if the original data has k values the model will require k – 1 dummy variables.
The null hypothesis is
H0: µ1 = µ2 = µ3
where xj = the score for Flavor group j. The linear regression model is
![]()
Meaning of dummy codes
Note that
![]()
since for the Flavor 1 group, t1 = 1 and t2 = 0.
![]()
since for the Flavor 2 group, t1 = 0 and t2 = 1
![]()
since for the Flavor 3 group, t1 = 0 and t2 = 0
Thus the null hypothesis given above is equivalent to
![]()
Simplifying, this means that the null hypothesis is equivalent to:
H0: β1 = β2 = 0
Regression Analysis
The results of the regression analysis are displayed in Figure 2.

Figure 2 – Regression analysis for data in Example 1
We now compare the regression results from Figure 2 with the ANOVA on the same data found in Figure 3. Note that the F value 0.66316 is the same as that in the regression analysis. Similarly, the p-value .52969 is the same in both models.

Figure 3 – ANOVA for data in Example 1
Note the following about the regression coefficients:
- The intercept b0 = mean of the Flavor 3 group = 14.
- Coefficient b1 for variable t1 = mean of the Flavor 1 group – mean of the Flavor 3 group = 12 – 14 = -2
- Coefficient b2 for variable t2 = mean of the Flavor 2 group – mean of the Flavor 3 group = 11.5 – 14 = -2.5
This is consistent with what we noted above when relating the population group means to the population coefficients, namely µ3 = β0, µ1 = β0 + β1, and µ2 = β0 + β2.
Alternative Coding
Example 1 (alternative approach): An alternative coding for Example 1 is as follows
t1 = 1 if flavoring 1 is used; = -1 if flavoring 3 is used; = 0 otherwise
t2 = 1 if flavoring 2 is used; = -1 if flavoring 3 is used; = 0 otherwise
In general, If there are k groups then the jth dummy variable tj = 1 if the jth group, tk = -1 if the kth group, and = 0 otherwise.
The data now can be expressed as in the table on the left of Figure 4.

Figure 4 – Alternative coding for data in Example 1
The null hypothesis and linear regression model are as before. Now we have:
![]()
since for the Flavor 1 group, t1 = 1 and t2 = 0
![]()
since for the Flavor 2 group, t1 = 0 and t2 = 1
![]()
since for the Flavor 3 group, t1 = -1 and t2 = -1
Thus the null hypothesis is equivalent to β0 + β1 = β0 + β2 = β0 – (β1 + β2). Simplifying, this means once again that the null hypothesis is equivalent to:
H0: β1 = β2 = 0
Note too that μ2 = β0 – (β1 + β2) = β0 – (μ1 – β0 + μ2 – β0), and so β0 = (μ1 + μ2 + μ3)/3, i.e. β0 = the population grand mean. Also β1 = μ1 – β0 and β2 = μ2 – β0, and so β1 = the population Flavor 1 mean less the population grand mean and β2 = the population Flavor 2 mean less the population grand mean.
The results of the regression analysis are given on the right side of Figure 4.
Interpretation
The first Summary and ANOVA tables are identical to the results from the previous analysis, and so once again we see that the results are the same as for the ANOVA. The regression coefficients, however, are different.
Figure 5 displays the grand mean, the group means, and the group effect sizes (i.e. the group mean less the grand mean).

Figure 5 – Group means and group effect sizes
We note that the intercept of the regression model is the grand mean 12.5 and the other coefficients correspond to the group effects for the Flavor 1 and Flavor 2 groups.
Two Factor ANOVA
We now show how to use regression to perform two factor ANOVA.
Example 2: Repeat the analysis from Example 1 of Two Factor ANOVA with Replication on the reduced sample data in the table on the left of Figure 6 using multiple regression.

Figure 6 – Data for Example 2
This time we show how to perform two-factor ANOVA using multiple regression. As we did in the previous example, we first define the dummy variables as follows:
t1 = 1 if Blend X; = 0 otherwise
t2 = 1 if Corn; = 0 otherwise
t3 = 1 if Soy; = 0 otherwise
The data now takes the form shown in Figure 7 where y is the yield.

Figure 7 – Coded data for Example 2
Note that this time we model the interaction of t1 with t2 and t3, as described in Interaction. The regression model that we use is of form
![]()
Group Means
We now build a table of the means for each of the 6 groups (i.e. cells), as described in Figure 8.

Figure 8 – Group means for Example 2
The data in Figure 8 can be constructed by calculating the means of each of the above 6 groups from the original data or by applying the AVERAGEIFS function to the transformed data.
As we did in Example 1, we note that the mean for Blend Y and Rice (i.e. where t1 = t2 = t3 = 0) is given by
![]()
and similarly for the other combinations:
![]()
![]()
![]()
![]()
![]()
Solving the simultaneous equations, we get the following values for the coefficients:
b0 = 165.4 b1 = -24.2 b2 = -5.8 b3 = -25.2 b4 = 0 b5 = 59.8
Regression Analysis (two-way ANOVA)
We get the same results when we run the Regression data analysis tool (see Figure 9).
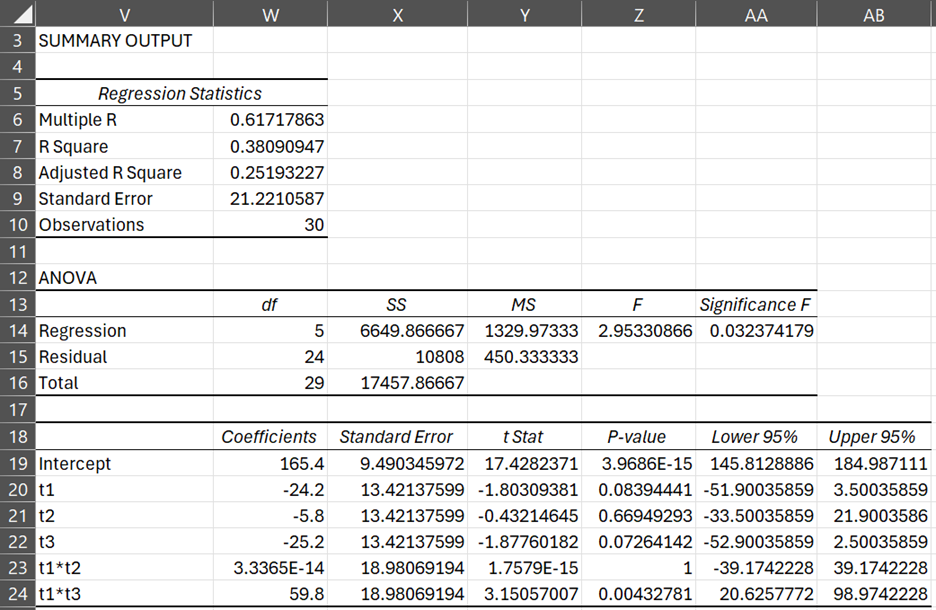
Figure 9 – Regression for data in Example 2
The relatively high value of R and low value of Significance F show that the above model is a sufficiently good fit. Using the ANOVA: Two factor data analysis tool, we get the output shown in Figure 10.

Figure 10 – Two-factor ANOVA for the data in Example 2
Obtaining ANOVA results
We now show how to obtain the ANOVA results from the Regression model and vice versa. Note that MSW = 450.33 = MSRes, which is as expected since both of these denote the portion of the variation due to error. Also note that MST = 17457.87/29 = 602.00 for both models, and so the systemic variation for both models is the same as well. For the ANOVA model this is
![]()
= (136.53 + 553.27 + 5960.07) / (1 + 2 + 2) = 6649.87/5 = 1329.97
This is the same as MSReg = 6649.87/5 = 1329.97 for the Regression model.
To obtain the Rows (A), Columns (B), and Interaction (AB) values in the ANOVA model from the Regression model, first rerun the regression analysis using only t1 as an independent variable. The values obtained for SSReg, dfReg and MSReg are the values of SSRow, dfRow and MSRow in the ANOVA model. Then rerun the regression analysis using only t2 and t3. The values obtained for SSReg, dfReg and MSReg are the values of SSCol, dfCol and MSCol in the ANOVA model. Now SSInteraction = SSBet – SSRow – SSCol (and similarly for the df terms) where SSBet is SSReg in the original (complete) regression model.
Finally, note that the value of R Square = .381. This has two interpretations. First, it is the square of Multiple R (whose value = .617), which is simply the correlation coefficient r. Second, it measures the percentage of variation explained by the regression model (or by the ANOVA model), which is
SSReg/SST = 6649.87/5793 = 0.381
which is also equal to 1 – SSW/SST from the ANOVA model.
Alternative Coding
Just as we did in the single factor ANOVA of Example 1, we can obtain similar results for Example 2 using the alternative coding of dummy variables, namely
t1 = 1 if Blend X; = -1 otherwise
t2 = 1 if Corn; -1 if Rice; = 0 otherwise
t3 = 1 if Soy; = -1 if Rice; = 0 otherwise
This approach is especially useful in creating unbalanced ANOVA models, i.e. where the sample sizes are not equal in a factorial ANOVA (see Unbalanced Factorial Anova).
Worksheet Function
Real Statistics Function: The Real Statistics Resource Pack supplies the following array worksheet function.
SSAnova2(R1, r) – returns a column array with SSRow, SSCol, SSInt and SSW for Two Factor ANOVA for the data in R1 using a regression model; if r > 0 then R1 is assumed to be in Excel Anova format (with row/column headings) with r rows per sample, while if r = 0 or is omitted then R1 is assumed to be in standard format (without column headings).
ANOVA Residuals
Now that we have explained how ANOVA is really regression using categorical variables, we can define ANOVA residuals. Click here for more information about ANOVA residuals.
Examples Workbook
Click here to download the Excel workbook with the examples described on this webpage.
References
Howell, D. C. (2010) Statistical methods for psychology (7th ed.). Wadsworth, Cengage Learning.
https://labs.la.utexas.edu/gilden/files/2016/05/Statistics-Text.pdf
Trochim, W. (2024) Dummy variables
https://conjointly.com/kb/dummy-variables/
I wish I had found these articles earlier. Very informative. I was looking for exactly this. Thanks a lot!
Actually for my work, I have to analyze a factorial experiment with binary outcomes. Online conversions, to be specific. The outcome would be 1 or 0 for repeated runs, and a conversion proportion if the averages of the runs are considered. In any case, ANOVA wouldn.t help as the outcome isn’t normally distributed. (Please correct me if I have got this wrong). So I think a Logistic Regression based analysis would be a good choice.
I think it can be done along the lines of the Linear Regression based analysis you have presented. Thank you again.
Hello Aditya,
Glad that you found the webpage interesting.
I am not familiar with a logistic regression based version of ANOVA, but it does seem to make sense.
Charles
Thanks Charles. Here’s the link to an article that uses Logistic Regression for comparing means – https://support.sas.com/resources/papers/proceedings12/206-2012.pdf
Aditya,
Thanks for sending me this link.
Charles
Dear Carlos,
Your website are light me up in statistics analysis…
but i hv a question related to my thesis,
i’d like to compare the significance different within more than 3 polynomial curve.
said tht the curve represent a bacterial growth in different media.
what kind of analysis should i use?
Dear Thea,
How are the polynomial curves specified? Are you given the coefficients for each polynomial? Can we assume that each of the polynomials has the same degree?
Suppose that I have two quadratic polynomials x^2 + bx + a and x^2 + dx + c, can I assume that the polynomials are significantly different when either b is significantly different from d or a is significantly different from c (or both)?
Charles
Dear Charles,
I am here for requesting some help for an article that I’m writing.
I have the following experimental design:
Dependent variable: Flexural strength (continuous)
Factor 1: Irradiance (categorical – Two levels: 300 mW/cm^2 and 800 mW/cm^2)
Factor 2: Radiant exposure (categorical – Two levels: 8 J/cm^2 and 16 J/cm^2).
Originally, Two-way ANOVA analysis was used to evaluate the effect of factors (irradiance and radiant exposure) on dependent variable. However, after the peer-review process, on reviewer asked this:
“You analyse by two-way ANOVA, which leads to a lot of uninteresting p-values in the results section. If you can use two-way ANOVA, you can also use linear regression of the outcome(s) as a function of the values of the two factors. this is a much more interesting analysis, as the regression coefficients will estimate the effect on the outcome”.
I was wondering how can I conduct such analysis with the type of data that I have. Do the factors can be used as continuous data to perform the multiple linear regression analysis?
Thanks in advance.
Carlos,
Two-way ANOVA is essentially an application of linear regression. The independent variables can be categorical (in which case you use dummy variables). That the dependent variable is continuous points towards linear regression, while if the dependent variable were categorical you would likely use binary logistic regression or multinomial logistic regression.
The advantage of the approach recommended by the reviewer is that you can interpret the regression coefficients to help you measure quantitatively the various effects.
Charles
Dear Charles,
Thank you for your kindly answer.
I have some difficults to understand the concept of dummy variables here. I’m trying to perform the multiple linear regression test using the following design:
– 300 or 800 for the independent variable 1 (factor 1, I’m considering as continuous now).
– 8 and 16 for the independent variable 2 (factor 1, I’m considering as continuous now).
– the dependent variable is already continuous.
Would be that a valid approach?
I fit a regression model to W and found equation as:
𝑊 = −5.386+ 1.849∗𝑃 +0.336∗𝑆 +0.093∗𝐹 −0.008∗𝑆 ∗𝐹 (coded equation if you want to 𝑊 = 6.420+ 0.462∗𝑃 −0.384∗𝑆 +0.362∗𝐹 −0.188∗𝑆 ∗𝐹)
I fit another regression model to H and found the equation:
𝐻 = 2.240+ 0.339∗𝑃 −0.226∗𝑆 +0.268∗𝐹 +0.139∗𝑃 ∗𝑆 −0.074𝑆 ∗𝐹 −0.157∗𝑃2
If I want to find W/H, should I simply divide above two
OR should I find C = W/H from the data and them find a regression model to C?
How do we interpret two differently?
Sid,
Probably C = W/H since the regression model for C may not be linear, If you are ok with a non-linear model, then I am not sure which would be better (based on which provides better forecasts). I suggest that you try each approach and see which gives better results.
Charles
How can I make nova for three factor in excel, put in mind that there are no correlation between these factors.
Ahmed,
See the following webpages:
https://real-statistics.com/two-way-anova/anova-more-than-two-factors/
https://real-statistics.com/two-way-anova/real-statistics-support-three-factor-anova/
https://real-statistics.com/multiple-regression/three-factor-anova-using-regression/
Charles
Dear Charles,
I’d be very grateful for your help. I have a dataset that I think would be best analysed by ANOVA using regression but am uncertain.
My data concerns a condition which either progresses or naturally resolves. I consider Progression or resolution to be categorical dependent variables. My independent variables are continuous data, of which there are four: a, b, c and d (However d is actually the sum of b-c).
The sample sizes between my dependent variables are different.
My hypotheses are:
1: that either resolution or progression can be predicted by one of, or a combination of a,b,c or d.
2: the mean values of a,b,c and d are significantly different between the resolving and progressive groups
Could you comment on whether ANOVA with regression is appropriate to analyse my data? Many thanks for both your help and your contribution with your software!
Charles,
I am having a difficulty to get the SSAnova2(R1, r) array function working.
I used the data set arrangement given Figure 6 as the Excel format as R1 and r=5 as there are 5 repetitions for each brand (ie, =SSAnova2(Figure 6 data without headings, 5). This functions returns with undefined value.
Likewise, based on the standard format data (given in Figure 7), the array function did not render the correct values. I did not use the second argument for this time.
Please advise where I made mistakes in using the array function SSAnova2(R1, r).
Thanks,
-Sun
Hi Sun,
1. Yes, you are correct. There is an error in the SSAnova2(R1, r) function when R1 is in Anova format and so r > 0. Thanks for identifying this serious error. I will fix this shortly.
2. SSAnova2(R1) does work correctly when R1 is in standard format. The data in Figure 7 is not in standard format. See instead the data in Figure 8 of Unbalanced Factorial Anova.
Charles
Thanks for clarifying the standard form I can use for the array function! It is my fault thinking the data with dummy variables.
Yes, the SSAnova2(R) works with the standard input format.
-Sun
Hello Sun,
I should mention one other thing. The Two Factor ANOVA data analysis tool does work properly even when your data is in Excel format and you choose the Regression option (which is why I created the SSAnova2 function in the first place).
Charles
Charles,
There is a typo in the equation of the between MS calculation for the 2 factor ANOVA:
It states that
“= (136.53 + 553.27 + 5960.07) / (1 + 2 + 2) = 46649.87/5 = 1329.97”
The numerator of the equation should be 6649.87. The calculated MS between value is accurate.
-Sun
Hi Sun,
Yes, the extra “4” is a typo, which I have now corrected. Thanks for identifying this mistake.
Charles
Charles,
Please correct the following typos under the alternative dummy values assignment Example 1:
currently it states that β1 = β0 – μ1 and β2 = β0 – μ2. These should be changed to
β1 = μ1 – β0 and β2 = μ2 – β0. However, the corresponding explanations provided are accurate.
Hello Sun,
Thanks for finding this error. I have now corrected it on the webpage.
Charles
Hi Charles,
I am doing an evaluation of workshops and wanting to compare a set of questions that participants competed before and after training in Excel. Afterwards I want to compare each workshop against each other and show the overall trend. Most workshops consisted of 10-20 participants with most of the same 7 questions being asked before and after.
I tried to do perform a two factor repeated measures ANOVA (two factor with replication in excel) however there are a number of non responses and to delete these my data would become unbalanced.
If you have any suggestions in regard to how I could best go about this I would very much appreciate it.
My second question is in regard to my second part of my evaluation. When I go to compare each workshop and find the overall trend, what test should I use? And what is the best visual way to show this in a report?
Hope to hear from you soon.
Hello Zaria,
For Anova with one fixed factor and one repeated measures factor (i.e. one between subjects factor and one within subjects factor) go to
https://real-statistics.com/anova-repeated-measures/one-between-subjects-factor-and-one-within-subjects-factor/
Since the you have an unbalanced model, see
https://real-statistics.com/anova-repeated-measures/repeated-measures-anova-using-regression/mixed-repeated-measures-anova-using-regression/
Re your second question: The test you use depends on what hypothesis you want to test. If you want to test whether the workshops perform equally, then the repeated measures ANOVA will test this. As far as the visual, I would suggest a chart with the overall change in test scores by workshop.
Charles
Thank you for clarification and good explanation. Would you please provide more information about estimation of “Significance F”. How 0.52969 and 0.03374 are estimated?
Abbas,
See https://real-statistics.com/multiple-regression/multiple-regression-analysis/multiple-regression-analysis-excel/
Charles
Charles,
If I compare Standard Error of the Regression to the Standard Error of Slope, the only difference is, the SE of the Slope is (SE Regression divided by Sum of Squares X). If I test several samples without changing the X values, do you agree that I could use SE of the Slope to judge the correlation between X and Y just as easily as using SE of the Regression? Of course I would have to adjust the acceptable limit to match the scale of the statistic.
Geoff,
The standard error of the regression is really only useful when there is more than one independent variable. With only one independent variable it is not surprising that the se of the regression and the se of the slope are equally useful.
Charles
Charles, thank you very much, this is quite helpful. I have another question.
Would you consider combining the Standard Error of the Slope and the Standard Error of the Intercept as useful as the Standard Error of the Regression. (after summing the slope and intercept variances, then taking the square root)?
Geoff,
You can do this, but it is not clear what role it would serve. There already is a standard error value for regression, namely the square root of MSE.
Charles
How are the standard errors of the slope, the estimate, and the regression defined?
Geoff,
See https://real-statistics.com/multiple-regression/multiple-regression-analysis/
Charles
thanks sir for this wonderful tutorial. from what you have solved so far regarding the two way ANOVA, the regression approach to the two way ANOVA did not give the regression for the rows,columns, and interaction separately rather they where all combined to give the REGRESSION. my question is that is there no way one can get the regression for the rows, columns, and interaction separately? thanks
I am not sure why you would want separate regressions, but to get rows (or columns) alone you can perform one-way Anova using Regression as described on the referenced webpage. I have not included a Real Statistics data analysis tool for doing this since you can simply perform one-way Anova to get the result. To get the interaction, you generally want to include the rows and columns, and so you wouldn’t want interaction alone.
Charles
So if you are constructing a 2×4 design matrix, you would essentially have 1 and three columns respectively? Since the other columns would be redundant? Is this why you left out “blend X” and “rice”?
Jack,
I left out Blend X and Rice just to make the number of rows in the example smaller. This is simply a different example from the one that included Blend X and Rice, and in fact I could have used the regression techniques for that example as well.
Charles
Hey,
I have a complete ANOVA table and want to draw a regression fit line.
How to do that ?
Ahmad,
You can draw an regression fit line at least for the case with only one x variable by using the Trendline option of a Scatter chart. If you have more than one x variable or are employing Anova using Regression, then the regression fit line is not a line but a hyperplane and it won’t be easy to draw.
Charles
Hi Dr.
Many thanks for this great work. Statistic became very easy with you. Thanks.
Is it possible to inform how to do ANOVA using regression by hand. Step by step with formulas. I need to understand it, to be able to explain it to my student and then can use your soft.
Thanks,
The referenced webpage shows how to perform ANOVA by manually modifying the output from the Excel regression data analysis tool. Elsewhere on the website I show how to manually perform the same calculations as Excel’s regression data analysis tool. If you combine both of the these, you have what you are requesting.
Charles
Hi Charles,
Can you show me an example of how to convert a one variable linear regression problem to ANOVA. I am struggling in how to divide the values in 2 groups.
Please help.
Distance (miles) Cost (USD)
337 59.5
2565 509.5
967 124.5
5124 1480.4
2398 696.23
2586 559.5
7412 1481.5
522 474.5
1499 737.5
The distance in miles is my predictor variable, and Cost(in USD) is my dependent variable.
Regards
The referenced webpage describes how to convert an ANOVA problem into a linear regression problem, not the reverse.
Why do you want to convert a linear regression into an ANOVA problem?
Charles
Hi. I’m stuck. I’m studying independent restaurants featuring vegan food in three catogories of restaurant types. I want to determine which out of the three are successful by using the rate of return of the past three years. Does this fall under the catogory of ANOVA regression? And to confirm, vegan and RofR are dependent variables and my three catorgories are IV?
Thanks
Michelle,
I don’t completely understand the scenario that you are describing. Can you give a specific example?
For example, suppose you have categories of restaurants A, B and C and 10 restaurants in each category along with their rate of return over the past three years. You should be able to use one-way ANOVA to determine whether there is a significant difference in the rate of return among the three categories. Note that since this is a balanced model (all categories have the same number of restaurants in the samples), you don’t need to use regression. See One-way ANOVA for details.
Charles
I’m feeling confident already.
thanks for your assistance and conformation.
Hello
I will like to know the importance of ANOVA after running a modertaed and hierarchical regression analysis. Research question: Do employee job satisfaction and demographic variables explain a significant amount of variance of ostracism?
Sorry Amina, but I don’t yet support these topics.
Charles
I just had a question: how is ANOVA like a multiple regression, as in what are the specific similarities? Hope you can answer my question soon. Thank you!
Cheryl,
I am asserting that you can carry out ANOVA by redefining it as a regression problem.
Charles
I’m not working on a problem exactly. It’s actually a question my professor gave as homework to answer and i have found it difficult to answer! The question is literally: How is ANOVA like a multiple regression? That’s all it says and goes to the next question. So, I’m stuck!
what is definition of analysis of variance in k-variable regression model.
Analysis of Variance is defined on the webpage One-way Analysis of Variance.
Regression is a way of performing the calculations required to create the model.
Charles
Hi,
Same problem for me.
Do you have found any solution for quadratic term SS computation ?
Thanks a lot
Luc
Thank you for your extremely useful website.
I have a question. I want to know whether a specific chicken feed affects height, length and weight of chickens. So I have a team of three raters, each recorded weight, length and height of each 50 chicken at time 0, 1 and 2 months after this specific feed.
How should I analyse these data?
I plan to do intraclass correlation coefficient first to ensure the reliability of different raters. Should I use one factor at one time-point (such as weight at time 0)?
How do I test for normality? Do I average weights of each chicken and test for normality, then do the same for length and weight?
If I want to look at one factor (such as height), I shall then do repeated measures ANOVA. But if I want to look at three factors (height, weight and length), do I do repeated measures ANOVA for each factor separately? Is there a better way? From my understanding, two-factor ANOVA with replication does not apply to this situation.
If I reject the null hypothesis, do I then do repeated measures ANOVA for each factor separately?
If I reject the null hypothesis of weight alone, how do I do post-hoc analysis in this situation?
I hope my question is not too troublesome. I look forward to hearing from you in due course and than you in advance for your help.
Kind regards
Gerard
Gerard,
Before answering any of these questions, it is important to understand what it is that you are trying to prove; i.e. what hypothesis are you trying to test. It seems that you are trying to understand whether the chicken feed is significantly better (in terms of the height, length and weight of chickens) compared to something unstated, probably the existing chicken feed. In this case it you probably want to use a MANOVA test (since you are comparing height, length and weight all at the same time.
You have given three time references 0, 1 and 2 months. If you care about the comparisons for all three periods then you will need a repeaated measures test. This might lead to a repeated measures MANOVA.
You also have three raters, but I don’t understand their role. Does each rater meausre the height, length and weight of each chicken or is their role different?
Before answering the detailed questions, please clarify the above issues.
Charles