ANOVA for main and interaction effects
Example 1: A new drug is tested on a random sample of insomniacs: 7 young people (20-40 yrs), 7 middle-aged people (40-60 yrs) and 7 older people (60+ yrs). The number of minutes each person sleeps per night is recorded for 5 successive nights on the left side of Figure 1. Determine whether the drug is effective.

Figure 1 – Data plus additional information for Example 1
In addition to the raw data in range B4:F24, the figure displays key counts: Age (cell J5) = # of levels in the Age factor = 3, Days (cell K5) = # of levels in Days factor = 5 and Subject (cell L5) = # of subjects in each Age group = 7.
Marginal means of all the intersections of Age × Days are given in range J9:N11, along with their sums. E.g. cell J9 provides the mean number of minutes slept by all the young subjects on day 1 via the formula =AVERAGE(B4:B10). Similarly, cell K12 provides the mean for all the subjects on day 2 via the formula =AVERAGE(K9:K11). Finally, the figure also provides a chart of Age × Days.
ANOVA analysis
We now can create the ANOVA analysis using the table in Figure 2.

Figure 2 – Sources of variation for Example 1
The Excel formulas used in Figure 2 are displayed in Figure 3. The SS terms of the first five items are derived using DEVSQ of the appropriate elements, while the other four are obtained by subtraction as described in Figure 2.

Figure 3 – Data elements from Figure 2
Output
From this table, we easily get the ANOVA report displayed in Figure 4.

Figure 4 – ANOVA for Example 1
Note that Subjects within Age is the error term for the between-subjects analysis and Days × Subjects within Age is the error term for the within-subjects analysis.
From Figure 4, we conclude there is a significant difference in Age group means (between-subjects analysis); i.e. the three age groups show a significant difference in the number of hours of sleep (averaged over the 5 days).
The figure also shows a significant difference in the Days means as well as the means of the interactions between Age groups and Days (within-subjects analysis). Thus there is a significant difference between the number of hours of sleep obtained by day (averaging over all three age groups) and there is a significant difference between the average hours of sleep by day and age group.
Assumptions
The assumptions that need to be met for the analysis described in Figure 4 to be valid fall into two categories: assumptions for the between-subjects analysis and those for the within-subjects analysis.
To see how to verify the assumptions for Example 1
- Click here for the between-subjects assumptions
- Click here for the within-subjects assumptions
Follow-up analyses
- Click here for the between-subjects follow-up analyses
- Click here for the within-subjects follow-up analyses
Real Statistics Capabilities
The GGEpsilon and HFEpsilon functions described in Sphericity can also be used in the case of Two Factor ANOVA with one fixed factor and one repeated measures factor. For example, referring to Figure 1, for Example 1, we have GGEpsilon(B4:F24,3) = .80 and HFEpsilon(B4:F24,3,7) = .998.
Real Statistics Data Analysis Tool: The Real Statistics Resource Pack provides a data analysis tool that supports Repeated Measures ANOVA with one within-subjects factor and one between-subjects factor.
For Example 1, press Ctrl-m and click on the Mixed Repeated Measures option from the Anova tab. If using the original user interface, press Ctrl-m and double click on Analysis of Variance (as shown in Figure 0 of Anova Analysis Tool) and select Repeated Measures: mixed from the dialog box that appears.
Finally, fill in the fields in the dialog box that appears as shown in Figure 5.

Figure 5 – Two Factor Repeated Measures ANOVA dialog box
The output is shown in Figure 6.
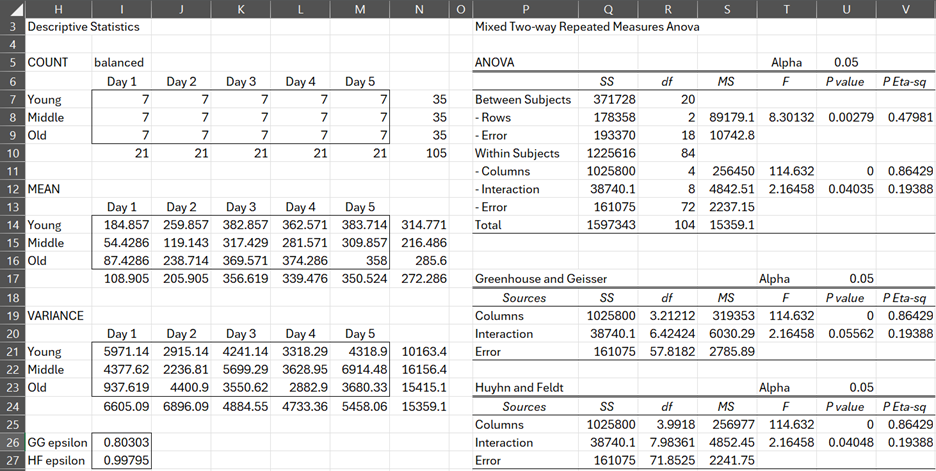
Figure 6 – Two Factor Repeated Measures ANOVA
Observation
We demonstrated how to use the Real Statistics data analysis tool when the data is in Excel format using the ANOVA method. In Repeated Measures ANOVA using Regression we show how to perform the analysis using the Regression method, which is especially useful for unbalanced models (i.e. the between-subjects factor levels have different sizes). We also demonstrate how to do the analysis for data in Standard format.
Examples Workbook
Click here to download the Excel workbook with the examples described on this webpage.
Reference
Howell, D. C. (2010) Statistical methods for psychology (7th ed.). Wadsworth, Cengage Learning.
https://labs.la.utexas.edu/gilden/files/2016/05/Statistics-Text.pdf
Charles,
As you note, “From Figure 4, we conclude there is a significant difference in Age group means.” From the graph it appears that the Middle group could have significantly lower minutes of sleep. Is it appropriate to compare means using the follow-up-analysis-for-two-factor-anova feature, or is there a better option? Thanks
The webpage describes a number of approaches for follow-up analysis. See the sections on this webpage denoted
– More detailed between-subjects analysis
– More detailed within-subjects analysis
Thus you can determine whether there is a significant difference between the Middle group and either of the other two groups for any specific time period. Are you interested, instead as to whether there is a significant difference between the middle group and either of the other groups across all time periods?
Charles
Thanks for the tips–I will review the more detailed analyses.
Yes, I am interested in any significant differences between groups across all time periods. It would be very useful to have an analysis similar to the two-factor ANOVA follow up. For example, on the tukey-hsd-after-two-factor-anova page Figure 3 shows that mosquitos in dry conditions bite significantly more than in cold conditions across all body locations.
Dave
Hi Dave,
Figure 4 shows that there is a difference between age groups. To get more details about this difference, you can perform one-way ANOVA and a Tukey HSD on the data in column G of Figure 1.
Charles
Column G (averages across time) used in a one-way ANOVA and Tukey HSD showed Middle age to have significantly fewer hours of sleep compared to Young (p = 0.002) and Old (p = 0.031). This makes sense and quantifies the impression from the Fig. 1 graph. Thanks again.
Glad I could help. I plan to add more repeated measures capabilities to Real Statistics in the next release.
Charles
Hi Charles,
What if the pre-treatment means of the age groups are different? Don’t we need to evaluate the change from the pre-treatment condition to determine whether the drug is effective? One approach might be to subtract the mean pretreatment minutes for each age group from the minutes observed, including the pretreatment day (this day will have mean changes of zero). Using Figure 1 data, if we assume the Day 1 results are before treatment then the two-factor ANOVA with repeated measures Rows (Age) p = 0.042, the average change over time ranges from 130 (Young) to 198 (Old), and the one-way ANOVA Tukey test of averages over time shows that Young and Old ages had a significantly different response (p = 0.033).
Yes, Dave, you are correct. Differences in pre-treatment means between groups need to be taken into account. You could subtract post minus pre or the percentage change or something else.
Charles
Hello Charles,
I’m figuring out if does it exists a multivariate extension of the one-between / one-within ANOVA.
I mean, I have a design similar to that in your example, but for each subject 11 dependent variables are measured at each time moment. These 11 variables are someway correlated among themselves, so I think that a multivariate approach would be better than to perform 11 separated ANOVAs.
The design is simplified because I have just two groups (males and females) and two time measures (pre and post-treatment) for the 11 variables.
However, the design is unbalanced (number of males different form number of females).
Thank you very much
Best Regards
Piero
Do you think it could be possible to set up a multivariate test?
Piero,
This design is certainly possible, but Real Statistics doesn’t yet support it.
Charles
Charles,
Many thanks for this phenomenal website; it is an incredible resource, and I have learned a great deal during my visits here. Your dedication and responsiveness to comments is fantastic.
In example 1 on this page, we currently observe differences in age group means, days means, and age group x days interaction. Is it possible to extract any significance between the individual subjects (either within the specific age groups or for all of the individuals as a whole)? For example, the SS for the subj. w/in age error constitutes 52% of the total SS between subjects, but we have no way to calculate F.
I’ve been trying to brainstorm a bit – could one repeat the analysis as a one-way ANOVA repeated measures for the whole data set and use the “Rows” output, which we normally ignore, to describe differences in individual results? (And by extension do one-way ANOVA separately for each age group to see variances within age group?)
Alternatively, based on some additional reading, I was wondering if one could use a nested approach within repeated measures rather than conducting multiple tests? An article I recently read stated that they treated the subject nested within group as a blocking variable to increase power and test for consistency within subjects. They were using SAS so I was wondering if you had any thoughts on how we might approach that in Excel? That said, however, many of the other references I have seen recommend using multilevel modelling instead of ANOVA for this scenario.
For repeated measures more generally, do you have any experience with whether the time spacing must be consistent? In example 1, each time point is separated by 1 day.
What if, for example, we have data on day 1, day 2, day 5, and day 10? I have seen conflicting information on this and was curious what you might recommend.
Apologies for the wordiness and many thanks for any feedback!
Nathan
Hello Nathan,
Sorry for the delayed response.
1. Subjects: We are generally not interested in the individual subjects.
2. One-way Anova: You can definitely perform a one-way repeated measures ANOVA using all the data if you are not interested in comparing the results by age. You can also perform three separate one-way repeated measures ANOVA for each age group. This would increase familywise error and you won’t have information that would enable you to make comparisons by age.
3. Nested and Multilevel Approach: I haven’t investigated these yet, although I may soon look at adding multilevel models to Real Statistics. In fact, I had hope to make a little more progress on this before responding to your comment.
4. Time spacing: As usual, it depends on what hypotheses you plan to test, but I don’t know know of any prohibitions against using different interval sizes.
Charles
Many thanks for taking the time to respond! (Especially to such a long and meandering set of questions.) I appreciate the insights and feedback.
Charles,
I just sent an email to you asking for your guidance. I have unbalanced data that can be analysed using the methods you described here. Because data are unbalanced, I have to calculate SS for individual factors taking into consider the different sample sizes. When I completed the first ANOVA table, one of the source of variations came back with a negative value, which surely implied that I made a mistake ( mistakes) somewhere before I get to that specific term. Since you will need to review my calculation to address where I made an error, I emailed an excel file to you with the background information.
I look forward to receiving your guidance on correcting my mistakes.
Thanks,
-Sun
Hello Sun,
Sorry for the delayed response. Since you have an unbalanced model, I suggest that you use a generalized regression approach, as described at
https://real-statistics.com/anova-repeated-measures/repeated-measures-anova-using-regression/mixed-repeated-measures-anova-using-regression/
Charles
Dear Charles,
I have a question about between-subject factor’s gender. In your example, gender’s effect to DV isn’t studied, though logically we know it might affect as an extraneous variable. To simplify the design study but prevent bias result from gender variable, what do I need to do? Is it to balance the ratio of male and female in every between-subject group OR to just use only one gender type for all participant in every between-subject group?
Your answer will be much appreciated! Thankyou
Hi Angel,
The analysis shown assumes that gender is not relevant (nor is education level, place where the people live, etc.). If you want to take gender into account then you need to add a second between subjects factor, Gender. This would make the analysis more complicated, but it is not unreasonable to do this. Currently, Real Statistics doesn’t support a two between-subjects and one withing subjects repeated measures ANOVA. This can, however, be done using repeated measures two-way MANOVA, which will be added to the Real Statistics capabilities in the next release, which I hope to get out this week.
Charles
Hi, Charles
Can you tell me how to determine how many samples I should have if I have 1 between factor (2 level) and 1 within factor (2 level)? And how can I define the statistical power with those sample?
Thank you
Charles,
Thanks for showing all the sources of variances in Example 1. It took a while for me to figure out all of them. Without your guidance, I would miss some for sure. I just want to point out there are a couple of notation errors in Figure 3.
The multiplier for “Between Subjects” should be b (ie, the number of days) and its degree of freedom should be am-1. Other notations are all correct.
Thanks,
-Sun
Hello Sun,
Yes, you are correct. Shortly, I will make the suggested corrections to the webpage. Thanks again for your help in improving the website.
Charles
Charles,
The contents of Figure 6 are not accurate as it only presents Day 1 data instead of the means over 5 days. The contents is simply a duplication of Figure 8. When your time is allowed, please correct Figure 6.
Thanks,
-Sun
Hello Sun,
Thanks for identifying another error. I have just inserted the correct version of Figure 6 on the webpage. Many thanks for your help in improving the website yet again.
Charles
Hi Charles,
I would like to know, which from the three factors more affect to the variable X. The value of variable X derived from 5 steps (variable A), each step contained 2 steps (variable B) and each step of variable B contained 2 steps also (variable C). So, the three factors: variable A (S,O,L1,L2,L3), variable B (20 and 40), variable C (half and whole). So, there are 20 conditions totally. These conditions were presented to the 20 subjects and the results were in the variable X. I would like to know also the correlation between and within the subject in these factors.
Could you please guide me how to do that!
Big thanks in advance.
Sasya
Hi Sasya,
Factor A has 5 levels and Factors B and C have 2 levels. Thus there are 5 x 2 x 2 = 20 combinations. Variable X then can be viewed as containing 20-tuples (with zeros or ones in each position) or as 3-tuples (with S,O,L1,L2 or L3 in the first position, 20 or 40 in the second position and half or whole in the third position.
In order to calculate the correlation, the value need to be at least ordered.
No problem if you use the 20-tuple approach, since all values are zeros and ones. You can then create a multiple correlation value assuming that you have a dependent variable. This is essentially calculated by regression the dependent variable on the 20 independent variables. Oops, you have a problem since you need more than 20 subjects if you have 20 independent variables.
For the 3-tuple approach, there is no problem for factors B and C, which can be ordered as 0 and 1. For factor A, you need to decide whether S,O,L1,L2,L3 can be assigned values such as -1,0,1,2,3 (or any other values you like), or whether these values are categorical and so can’t be compared.
If the values can be assigned numbers then you can calculate a multiple correlation coefficient via regression assuming you have some dependent variable.
It is not clear to me what use this correlation coefficient will have or whether it addresses any need that you have. It also doesn’t correspond to within or between subjects. I don’t know what that would mean in this case anyway.
Charles
Dear Professor Charles,
I am very much impressed by your examples and comments in Real Statistics which I greatly appreciate!!
Regarding the above topic : One beween and one within factor, I would be very much obliged if you clarify in a Statistical context
1) What is the criterion for the drug effectiveness. Which parameters or statistics we want to compare ?
2) What subject mean is ? Average over age group number m or over no of days ?
3) Between which factors is the Within Subjects part of Anova set up ??
4) Why can’t we use a two factor Anova, one factor age , the other days and m replications over the m subjects ??
I thank you in advance for your valuable answer.
Elias / Athens Greece
Hello Elias from Athens. Excellent questions.
1. For Example 1, I would say that the drug is effective if there is a significant increase in the number of hours of sleep from Day 1 to a later date, especially Day 5.
2. Each Day has its own subject mean. Each group has a subject means. You can also have a subject mean for each Day x Group.
3. Within Subjects refer to the difference between Days (same subjects). The Between Subjects refers to differences between the groups.
4. Two factor Anova requires that the levels in each factor are independent. Since in this example, for each subject the scores for the different days are not independent (they are for the same subjects after all).
Charles
Heya this is somewhat of off topic but I was wondering if blogs use WYSIWYG editors or if you have to manually code with HTML.
I’m starting a blog soon but have no coding knowledge so I wanted to
get guidance from someone with experience.
Any help would be greatly appreciated!
I used WordPress which presents an WYSIWYG editor. I supplement this with WP Edit.
Charles
Hello sir. I think there is a mistake in the symbology of figure 3. The Between subjects SS should be: “b * DESVQ(subject means)”; instead of “m * DESVQ(subject means)”. Also, the df for Between subjects again should be “am -1” instead of “bm -1”. Both observations taking into account that a=3, b=5 and m=7. Please do tell if this is incorrect. I’ve been using your website a lot these days and it’s been very useful. Thank you very much!
Gibran,
I am pretty sure that I checked the results obtained on this webpage with a couple of other software packages and I got the same result, and so I believe that the calculations are correct. I can certainly understand that you might prefer to interchange a with b throughout, but not b with m.
Perhaps I am missing something, but why do you think there is a mistake?
Charles
Thank you,
Jean
Hello Charles,
I am confused. I am searching for information about a Mixed ANOVA (repeated measure, within-between) statistical procedure, but I have not been successful. Could there be another name for this analytical procedure? I found information about a Two-way Mixed ANOVA that seem to fit with my study. My dependent variable is continuous (interval) and the independent variable is categorical (nominal). I have 3 levels in the “within-subjects” factor and 2 groups in the “between-subjects” factor.
I would appreciate your feedback.
Jean
Jean,
What Real Statistics calls Mixed Repeated Measures ANOVA is a Repeated Measures ANOVA with one between subjects factor and one within subjects factor. Your study seems to fit this model.
Charles
Hey Charles,
I’ve been using this site for quite a while now and it’s quite something. I have a dataset to evaluate, that’s pretty much the same as the example here. Its made of two groups of patients, randomized, one with the test medication and one in placebo. Both groups responded to a few questionaries, throughout 4 weeks. The first one had many non-responders, and as such missing data, but the other 3 basically had none missing data. For the first one, I was planning on Mann Whitney over the weeks’ averages, and for the others to use this model ANOVA. So my questions are: for this kind of analysis, is the repeated measurements ANOVA more solid then Maan Whitney, or it would be better to apply Mann Whitney for all (its a 1:1 balanced model) ? Also, is this model ANOVA not usable for unbalanced models as a methodologic limitation or software limitation? Oh yeah, and finally, I would like to put this add-in in the statistical methodology as a citation and this site link as a reference since its mostly the program I’m using nowadays, may I?
Vitor,
I am pleased that are getting value from the website.
What tests to use, depends on which hypotheses you wish to test. If you are going to compare the two groups of patients for week 1, then you can use a two independent sample t test (provided the normality assumption is met (or Mann-Whitney otherwise). This approach can be used for week 2, 3 or 4 as well. There is no problem if the sample sizes for the two groups are different.
If you want to compare week 1 with week 4 for group 1, then you can use a paired t test provided the normality assumption is met (or Wilocoxon signed ranks test if not). You will need to eliminate any pateint which doesn’t have a measurement for both time periods. This approach can also be used for group 2.
You can also do an analysis with one repeated measure factor (Weeks) and one fixed factor (Group), as described on the referenced webpage. You can also accomplish this when the two groups are different in size (unbalanced model), as described on the following webpage:
https://real-statistics.com/anova-repeated-measures/repeated-measures-anova-using-regression/mixed-repeated-measures-anova-using-regression/
This approach takes care of different sample sizes, but it won’t take care of any missing time data. Any patient without a measurement for all 4 weeks needs to be eliminated (or some other missing data technique used).
You are free to cite the website and software. See the following webpage for the recommended citation:
https://real-statistics.com/appendix/citation-real-statistics-software-website/
Charles
sorry, what is “i”? (Figure 3)
Ryder,
It is a typo. Thanks for identifying this. I have now corrected the figure with the correct letters.
I appreciate your diligence in finding this error.
Charles
Good morning Charles:
I have a little question about the general formulas of two way anova with repeated measures. I have been tried to undersand this, with the example 1.
I found the next algorithm (if I wrong, please let me know Sr):
SST=SSB(subj)+SSW(Subj);
SSB(subj)=SSB(Rows=ages)+SSW(error)
SSW(subj)=SSW(days)+SSB(intera between groups)+SSB(inte between subject)
1. SST=Devia2(B4:F24)=1597343
2. SSB(subj)=Days*Devia2(G4:G24)=371728
3. SSW(subj)=SST-SSB(subj)=1225616
4. SSB(ages)=Days*Subjects*Devia2(N14:N16)=178358
5. SSW(interaction within subject)=SSB(Subj)-SSB(ages)
6. SSW(days)=Ages*Subj*Devia2(I17:M17)
7. SSB(interaction between groups)=????????
8. SSB(interaction between subject)=SSW(subj)-SSW(days)-SSB(interaction bet groups)
I have been tried to get my own answer by the next algorithm, but I don´t know if this is the correct assumption ( it is like two way anova with independent samples and without replications)
SST=SSB+SSW
SSB(AxB)=SSB(columns)+SSB(rows)+SSB(interaction between groups)
SSW (AxB)=SST-SSB(AxB)=SSB(inter within subject)+SSW(inter between subj)
1. SST=Devia2(B4:F24)
2. SSB(AxB)=Devia2(I14:M16)*subject (mean table)
3. SSB(ages=rows)=Days*Subjects*Devia2(N14:N16)
4. SSW(days=columns)=Ages*Subj*Devia2(I17:M17)
5. SSB(interaction between groups)=SSB(AxB)-SSB(ages)-SSW(days): bingo!!!!
And the last question is:
SSW(interaction within subject)= error within subject or between?
SSW(inter between subject)= error between subject 0r within?
See the Mixed-design ANOVA (W12) table of http://faculty.lagcc.cuny.edu/tnagano/research/r/#One-way%20ANOVA%20(W8)
Thank you very much in advance Sr.
Best regard
Felix
Felix,
Sorry, but I don’t understand what your questions are.
Charles
hi Charles
is the unbalanced model for two factor repeated anova ready in your latest software?
Belle,
I am now working on split-plot ANOVA and Tukey’s HSD for repeated measures ANOVA plus a few other things. I am hoping to include some unbalanced model support as well, but that all depends on how much I can get done in the next couple of weeks, especially since I also plan some vacation time. In any case, the next release should be available later this month.
Charles
Hi Sir,
I have three groups of animals that received three different treatments (control, treatment A and Treatment B). Every group is 8 animals. I tracked the therapeutic response (one therapeutic measure, for example, tumor size) in the three groups at different time points (1 week, 2 weeks and 3 weeks post treatment). Which ANOVA should be used in this case? Im thinking of TWO way ANOVA with replication? but i’m not sure its correct? and why without replication might not be correct?
Thanks
Sherif,
I believe that you are correct: one fixed factor (treatment) and one repeated measures factor (time).
Charles
Hi Charles,
This website is a great resource.
I am trying to work through the ANOVA analysis table in Figure 2.
I can only calculate the same value for S6 with [bm * DEVSQ(age group means)] and S7 with [am * DEVSQ(days means)]. The a and b values are reversed from your equations in Figure 3. Is this a typo?
Thanks!
Cynthia,
You are correct. This is a typo. I have just corrected the formulas on the referenced webpage.
Thanks very much for catching this mistake.
Charles
Hi, Charles,
Thanks for your website! You are making my MS thesis data analysis 100x easier. I will have to learn R or SAS or etc. eventually, but for now this is a life-saver.
Question for you: How were you able to generate the box plots (i.e., Figure 5 and Figure 7)? I downloaded the Example Workbooks and have no problem seeing which tables/data were used to generate the plots, however, it is not clear which function in Excel you use to create them. For example, if you are in Excel and click on the Insert Tab -> Charts, which chart do you use? Or, is there another way to generate the plot that I am overlooking?
I am not sure if my question is clear. I’ll be happy to try and clarify if you need.
Cheers,
Phyllis
hi Charles
not sure why my query is being deleted. I need to know how to do within and between subject anova if my samples are not the same size (unbalanced model).
control grp (n = 33) vs intervention grp (n = 24) which both groups underwent pretest and posttest.
If I have a few DVs, is there a MANOVA that handles such design too?
Not to worry. Your query has not been deleted. I have not yet had the time to post your comment and provide a response.
Charles
hi, can you explain how to do similar mixed repeated anova for unbalanced model? i’ve a control group (N = 33) and intervention group (N = 24) in a pre-post-test setting. tried to arrange the data according to what I did for two-way anova (regression) but i got errors for mixed repeated anova. will the answers be the same if i do unpaired t and paired t instead then?
I understand the following to be the problem that you are addressing. Please let me know if I have understood this correctly.
You have two independent groups: a control group and an intervention group. For each group you have data for two (dependent) events: pre- and post-test. You have 33 pre-test data elements for the control group, 33 post-test data elements for the control group, 24 pre-test data elements for the intervention group and 24 post-test data elements for the intervention group.
If this is correct, then one approach is to create a balanced model, by randomly removing 9 pairs of data from the control group. The disadvantage of this approach is that the sample size, and therefore the power of the test, will be reduced, but in this case you can use the capabilities described on the website.
I am about to start updating and upgrading the regression capabilities described on the website and implemented in the Real Statistics Resource Pack. I will look into the issue of unbalanced mixed repeated measures Anova.
You should be able to perform a “post-hoc” t test between the control and intervention groups for pre-test (or post-test) using the t test with independent samples (the sample sizes don’t need to be equal). You should also be able to perform a “post-hoc” paired t test for the control group (or the intervention group).
Charles
hi charles
yes, you’re right about my current research resign.
can i know which of your functions should i choose to have the randomly elimination of 9 extras so that i can have a balanced model comparison?
i recalled having to see some functions which can actually transpose or reorganise data so that the control group of n=33 can be all used to reduce to a revised control group n=24 without eliminating a random 9. do you think you can help with this?
for the post-hoc tests, am i right to say that i can only do so if i uses a ANOVA test with more than 2 set of dependent data?
can you enlighten what will i lose by doing a unpaired t (pre vs post of control then of intervention) and a paired t (control vs intervention at pre then at post)?
belle 🙂
Belle,
Q. can i know which of your functions should i choose to have the randomly elimination of 9 extras so that i can have a balanced model comparison?
A. Suppose your data is in range A1:A33. Enter the formula =RAND() in cell B1, highlight the range B1:B33 and press Ctrl-D. This will put random numbers in cells B1 through B33. Now put the formula =SMALL(B1:B33,9) in cell B35. This cell will contain the 9th smallest of the random numbers. Now place the formula =IF(B1<=$B$35,"",A1) in cell C1, highlight the range C1:C33 and press Ctrl-D. Range C1:C3 will now contain the original data except that the values in 9 random cells will be replaced by blanks. Q. i recalled having to see some functions which can actually transpose or reorganise data so that the control group of n=33 can be all used to reduce to a revised control group n=24 without eliminating a random 9. do you think you can help with this? A. There are various types of Imputation approaches to add 9 elements to the control group, although there are shortcomings with each of these approaches. See Handling Missing Data.
Q. for the post-hoc tests, am i right to say that i can only do so if i uses a ANOVA test with more than 2 set of dependent data?
A. If the ANOVA test only has two levels for some factor, there is no point in performing a post-hoc test on that factor (since th ANOVA test has already done it).
Q. can you enlighten what will i lose by doing a unpaired t (pre vs post of control then of intervention) and a paired t (control vs intervention at pre then at post)?
A. Sorry, but I don’t understand this question.
Charles
hi Charles
can I know if the unbalance model for two factor repeated anova being created? do you have an updated excel software since this qs was posted to you at jul 2015?
Sorry, but I have been busy with other things. Fortunately I am finishing these now, and will return to completing the next release of the software. I hope to have enough time to include the feature you are looking for in the next release. If there isn’t enough time, it should be in the release after that.
Charles
hi Charles, can I know if it is available now for unbalanced model?
It is not yet available, but it is one of the next things I will be working on.
Charles