Even when the homogeneity of variance assumption is violated the ordinary least squares (OLS) method calculates unbiased, consistent estimates of the population regression coefficients. In this case, these estimates won’t be the best linear estimates since the variances of these estimates won’t necessarily be the smallest. Worse yet the standard errors will be biased and inconsistent.
Robust Standard Errors
In Huber-White’s Robust Standard Errors approach, the OLS method is used to calculate the regression coefficients, but the covariance matrix of the coefficient matrix is calculated by
![]()
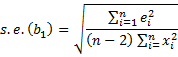
where S is the covariance matrix of the residuals. Under the assumption that the residuals have a mean of 0 and are not autocorrelated, i.e. E[e] = 0 and E[eeT] = 0, S is the diagonal matrix whose diagonal elements are 
![]()
![]()
Thus, to calculate the standard error for the regression coefficients when the homogeneity of variance assumption is violated, we need to calculate cov(B) as described above based on the residuals for the usual ordinary least squares calculation.
while if the homogeneity of variances assumption is not met then
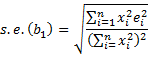
The Huber-White robust standard errors are equal to the square root of the elements on the diagonal of the covariance matrix.
![]()
where the elements of S are the squared residuals ei from the OLS method. We call these standard errors heteroskedasticity-consistent (HC) standard errors.
Types of Robust Standard Errors
Heteroskedasticity just means non-constant variance. These estimates are BLUE (best linear unbiased estimate), but only for large samples. We next define four other measures, which are equivalent for large samples, but which can be less biased for smaller samples. Each estimate is again the square root of the elements of the diagonal of the covariance matrix as described above, except that we use a different version of S.
![]()
![]()
![]()
![]()
Here, the hi are the leverage values (i.e. the diagonal elements of the OLS hat matrix, as described in Multiple Regression using Matrices and Multiple Regression Outliers and Influencers), n = samples size and k = number of independent variables.
HC1 adjusts for degrees of freedom. HC2 reduces the bias due to points of high leverage. HC3 tends to produce superior results than HC2. HC4 is a more recent approach that can be superior to HC3.
Data Analysis Tool
Real Statistics Data Analysis Tool: The Multiple Linear Regression data analysis tool contains an option for calculating any one of the versions of Huber-White’s Robust Standard Errors described above. This is demonstrated in the following example.
Example 1: Repeat Example 2 of Multiple Regression Analysis in Excel using the HC3 version of Huber-White’s robust standard errors. The first 17 out of 50 rows of the input data are shown in A3:E20 of Figure 2.
Enter Ctrl-m and double-click on the Regression option in the dialog box that appears. Next, select Multiple Linear Regression from the list of options and click on the OK button. Fill in the dialog box that appears as shown in Figure 1.
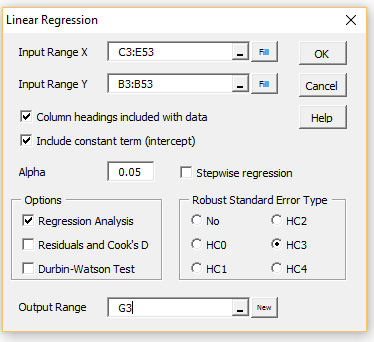
Figure 1 – Linear Regression dialog box
After clicking on the OK button, the output from the data analysis tool is shown on the right side of Figure 2. The standard errors using OLS (without robust standard errors) along with the corresponding p-values have also been manually added to the figure in range P16:Q20 so that you can compare the output using robust standard errors with the OLS standard errors.

Figure 2 – Linear Regression with Robust Standard Errors
As you can see from Figure 2, the only coefficient significantly different from zero is that for Infant Mortality. The standard error of the Infant Mortality coefficient is 0.42943 (cell I18) when using robust standard errors (HC3 version) versus 0.300673 (cell P18) using OLS.
Note too that some of the robust standard errors are lower than the corresponding OLS standard error and some are higher.
Caution: When robust standard errors are used, the F-statistic (cell K12 in Figure 2) is not accurate and so it and the corresponding p-value should not be relied on.
Worksheet Function
Real Statistics Function: The following array function computes the coefficients and their standard errors for weighted linear regression. Here R1 is an n × k array containing the X sample data and R2 is an n × 1 array containing the Y sample data.
RRegCoeff(R1, R2, hc, con) = kk × 2 range consisting of the regression coefficient vector followed by vector of standard errors of these coefficients, where kk = k+1 if con = TRUE (default) and kk = k if con = FALSE (regression without intercept) and hc = a value between 0 and 4 representing robust standard errors of HC0 through HC4 (default = 3).
For example, the range H17:I20 contains the worksheet array formula =RRegCoeff(C4:E53,B4:B53.
Examples Workbook
Click here to download the Excel workbook with the examples described on this webpage.
Reference
Hayes, A. and Cai, (2007) Using heteroskedasticity-consistent standard error estimators in OLS regression: An introduction and software implementation. Behavior Research Methods 2007, 39 (4), 709-722.
https://link.springer.com/article/10.3758/BF03192961
Is there a way to calculate a (robust) standard deviation from the robust standard error?
Hi Delwin,
What do you mean by a robust standard deviation?
Charles
I was wondering why F-stat changes when robust standard error is used. Based on the formula of F-stat, it mainly relies on the R2. Any clues? Thanks!
Joe,
The F-stat doesn’t change. Where do you see a change?
Charles
THE HC4 FORMULA DOES NOT MATCH THE RESULTS OF THE PROGRAM
Dear Antoni,
Thanks for identifying this problem.
I plan to issue a new bug-fix release in a couple of days to fix this.
I appreciate your help in improving the quality of the Real Statistics software.
Charles
Dear Charles,
Thanks for all the valuable information on this website!
I created a regression model with different factors (products) and a covariate (pressure) to analyse lubrication test data (In Excel + VBA). The dependent variable is friction. I used factor coding 0, 1.
I managed to calculate robust Standard Errors of difference using the variance-covariance matrix: SE of difference = SQRT(var(B1) + var(B2) – 2 * cov(B1, B2)). I use the SE of difference to perform a Tukey test. CI = Difference +/- Qvalue/sqrt(2) * SE of difference).
In some cases a model with interaction (product * pressure) is better than the model without interaction effect. I tried to calculate the SE of difference with the variance-covariance matrix including the interaction, but I cannot figure out how to calculate the SE of difference between 2 products in this case. There are a lot of values to choose from in the variance-covariance matrix with interaction. Is there a method to calculate the SE of difference with robust Standard errors for a model with an interaction effect?
Best regards,
Bart
Bart,
If the difference is one of the independent variables then you can use the robust standard error. Assuming that this is not the case, you can probably use the fact that var(x-y) = var(x) + var(y) – cov(x,y).
Charles
Dear Charles,
I am implementing robust standard errors in some new python code, and I am using your Excel add-in to check the results. It’s incredibly useful – thank you! For a least-squares fit using the test data on this page (poverty vs infant mortality for the 50 states), my code reproduces your HC0 values exactly. So my underlying matrix calculations are working and my diagonal S matrix must be correct. To obtain HC1, I understand that we need to multiply each element of the S matrix by {n/(n-k-1)}. However, the HC1 values do not then match yours. In case you want to investigate, I get [0.063540898, 0.808179873] from my code, and [0.064851157 0.824845129] from the add-in. I CAN match your results if I introduce the factor before squaring the residual, i.e. each element of the S matrix is { {n/(n-k-1)} * e }^2^ rather than {n/(n-k-1)} * e^2^. Which one of these is correct? Any advice would be much appreciated. Thanks.
Andrew,
Your version is correct. Thanks for identifying this coding error in the Real Statistics software. I will fix this error in the software shortly. I appreciate your help in improving the quality of the Real Statistics software.
Charles
what are the advanrages and disadvantges of using the robusr square errors ?
When the homogeneity of variance assumption is violated the ordinary least squares (OLS) method calculates unbiased, consistent estimates of the population regression coefficients. However, these estimates won’t be the best linear estimates since the variances of these estimates won’t necessarily be the smallest. Worse yet the standard errors will be biased and inconsistent. The advantage of using robust standard errors is to correct this deficiency. The disadvantage is that additional work is required to obtain robust standard errors.
Charles
good eveining. how to make conclusion based robust standard error, selecting the best correlation matrix based on the robust standard errors in generalised estimating equations.
Augustinus,
Sorry, but I don’t understand your question.
Charles
It´s hard to understand. Detected heteroskedasticity, I proceed regression using Robust Standard Errors, where I’m supposed to get heteroskedasticity-consistent standard errors. Doing that I get the same coefficients and standard errors slightly different from those obtained with OLS regression. HOW TO BE SURE THAT HETEROSKEDASTICITY IS SOLVED ? It would be interesting to plot the residuals obtained with the Robust Regression and compare with those from OLS Regression, but there’s no difference. Please let me know if I’m doing something wrong.
Hello José Roberto,
1. If you use robust standard errors, then the results should be pretty good.
2. Since the regression coefficients don’t change, there is no reason to expect that residuals will be different.
3. You can check to see whether the original data is heteroskedastic as described at
https://real-statistics.com/multiple-regression/heteroskedasticity/
Charles
Hello, I tried to run multi-variable regression per your instruction using the regression add-in provided, but it only gives me same results as non-robust standard error tests – why is that?
Hello,
You should generally get different answers (although this may not be so if homogeneity of variances is satisfied).
If you send me an Excel file with your data and regression analysis, I can try to figure out what is going on.
Charles
Hi Charles
I seem to be getting the same issue as above. From testing my data was found to be heteroscedastic. The overall fit is the same as standard OLS and coefficients are the same but standard error is different? Cheers
Are you saying that the standard errors are the same? In any case, if you send me an Excel file with your data, I will try to figure out what is going on. Also, note that the latest version of the Real Statistics software includes two tests for heteroscedasticity.
Charles