Multiple Regression with Logarithmic Transformations

Basic Concepts

In Exponential Regression and Power Regression we reviewed four types of log transformation for regression models with one independent variable. We now briefly examine the multiple regression counterparts to these four types of log transformations:

image7080

image7081

image7082

image7083

Level-level regression is the normal multiple regression we have studied in Least Squares for Multiple Regression and Multiple Regression Analysis. Keep in mind that the right side of these equations could also have a mix of log terms and non-log terms, such as y = b0 + b1 ln x1 + b2 x2.

Log-level regression

Log-level regression is the multivariate counterpart to exponential regression examined in Exponential Regression. Namely, by taking the exponential of each side of the equation shown above we get the equivalent form

image7084

Similarly, the log-log regression model is the multivariate counterpart to the power regression model examined in Power Regression. We see this by taking the exponential of both sides of the equation shown above and simplifying it to get

image7085

Since any positive constant c can be expressed as eln c, we can re-express this equation by

image7086

where clearly the b0 coefficients are not the same, and where a negative value for b0 is possible as well.

Log-level example

We now give an example of where the log-level regression model is a good fit for some data.

Example 1:  Repeat Example 1 of Least Squares for Multiple Regression using the data on the left side of Figure 1.

Log-level transformation Excel

Figure 1 – Log-level transformation

The right side of the figure shows the log transformation of the price: e.g. cell G6 contains the formula =LN(C6). We next run regression data analysis on the log-transformed data. We could use the Excel Regression tool, although here we use the Real Statistics Linear Regression data analysis tool (as described in Multiple Regression Analysis) on the X input in range E5:F16 and Y input in range G5:G16. The output is shown in Figure 2.

Log-level regression Excel

Figure 2 – Regression on log-level transformed data

The high value for R-Square shows that the log-level transformed data is a good fit for the linear regression model. Since zero is not in the 95% confidence intervals for Color or Quality, the corresponding coefficients are significantly different from zero.

LOGEST and GROWTH functions

We could also use the array formula =LOGEST(C6:C16,A6:B16,TRUE,TRUE) to obtain the following output (the labels have been manually added):

LOGEST function Excel

Figure 3 – Use of LOGEST function

Note that the slope/intercept values in row 7 of Figure 3 are the exponential of the linear coefficients calculated in Figure 2: e.g. the value of cell R7 is equal to EXP(J23) and the value of cell T7 is equal to EXP(J21).

We can also use the regression model to predict the price of a given diamond. For example, suppose a diamond has Color = 4 and Quality = 5 or Color = 7 and Quality = 7, then the following three approaches show how to predict the Price based on the regression model:

Forecasting log-level regression

Figure 4 – Forecasting using the log-level model

Log-log regression

Example 2:  Repeat Example 1 using the data on the left side of Figure 5.

Log-log transformation Excel

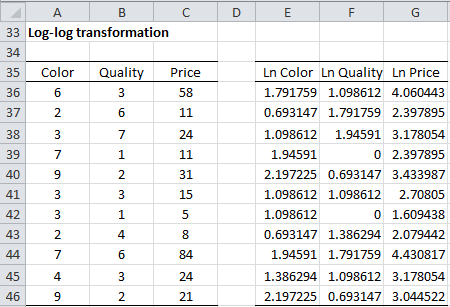
Figure 5– Log-log transformation

The right side of the figure shows the log transformation of the color, quality and price. We next run the regression data analysis tool on the log-transformed data, i.e. with range E5:F16 as Input X and range G5:G16 as Input Y. The output is shown in Figure 6.

Log-log regression Excel

Figure 6 – Regression on log-log transformed data

As in the previous example, we see from Figure 6 that the model is a good fit for the data. We can also use the regression model for forecasting. Note that there are LOGEST or GROWTH functions for the log-log transformed models, but we still have the following two approaches for forecasting:

Forecast log-log regression

Figure 7 – Forecasting using the log-log model

References

Yang, J. (2012) Interpreting regression coefficients for log-transformed variables. Cornell
https://10485378447908171212.googlegroups.com/attach/2580f2d6595ac/transformation%20interpretation.pdf?part=0.2&vt=ANaJVrFXAau4613bq0P64Yzc9x2BUK2zEhCfbsUcJo4rwe4IA3dqyuP8MGbJZ1vTGRs3tWTFiN9XH9LLoM0OArq5HIQjygHrYmQBr0nip2QBWJ9uiutdskE

Microsoft Support (2013) LOGEST function
https://support.microsoft.com/en-us/office/logest-function-f27462d8-3657-4030-866b-a272c1d18b4b

Microsoft Support (2013) GROWTH function
https://support.microsoft.com/en-us/office/growth-function-541a91dc-3d5e-437d-b156-21324e68b80d

124 thoughts on “Multiple Regression with Logarithmic Transformations”

  1. Hi! I want to do multiple linear regression on excel but I am a bit confused. One of my IVs is linear with the DV when I take the DV’s natural log (because it was an exponential function and I linearized it). My other IV is linear with just DV (not the log). On excel, I can only put either ln DV or just the DV. So how should I solve this? I would appreciate help since my school project is due soon. Thank you!

    Reply
  2. please help me understand an interpretation where in i have log transformed the outcome variable and the coefficient came as negative. The independent variable is a categorical variable. Now while interpreting the result should i take the exponential of the negative coefficient or just the absolute value of coefficient.
    eg; if coefficient is -1.15 should i take exp(-1.15) or exp(1.15) and take the relation as inversely proportional?

    Reply
  3. Hi, I am doing multiple regression analysis . one of my independent variables is a “ratio variable”. While running ardl model by log transforming all the 4 variables in my model, My results are significant only at 10% level of significance. However, if I just multiply the Ratio Variable by 100 i.e convert it into percentage form , while applying log to remaining variables and run ardl regression, the outputs are significant at 5% too. What should I do? the general form is as follows :
    LnY= a + a1 LnX1 + a2LnX2 + a3 X3 , where X3 is the ratio variable expressed in percentage.

    Reply
    • Hello Sandip,
      The regression LnY= a + a1 LnX1 + a2LnX2 + a3 X3 is different from nY= a + a1 LnX1 + a2LnX2 + a3 LnX3, and so it is entirely possible that you wiould get different results. Which form is more meaningful for the analysis you are trying to perform?
      Charles

      Reply
  4. Hi Charles,

    I’m doing a multiple regression analysis with log transformations on my dependent and independent variables. Two of my independent variables have datasets that contain zeros. To address this, I added a constant to all the data corresponding to those two independent variables. I’m now wondering if I need to add the same constant to my dependent variable and the other independent variables (that do not have datasets with zeros).

    Any clarification would be appreciated!

    Thanks,
    Raya

    Reply
  5. Is the power regression equation accurate. It looks like Beta^X. Shouldn’t it be X^Beta in figure 4.

    Additionally, can we use a linear equation (LN or Log) or multiple regression (LN or Log) equation either changing dependent and/or independent variables and change the coefficients for both? Meaning I’m compiling a model and want the coefficients to read ad they do linearly for an audience without having to transform just the dependent variable Y hat.

    Thank you kindly,

    Jason (Financial/Investment Analyst)

    Reply
    • Hi Jason,
      1. The log-level model is ln y = b0 + b1*x1 + b2*x2 + … + bk*xk. This is equivalent to y = exp(b0 + b1*x1 + b2*x2 + … + bk*xk), which is the same as y = exp(b0) * exp(b1*x1) * … * exp(bk*xk) since exp(a+b) = exp(a) * exp(b). But this is equivalent to y = exp(b0) * exp(b1)^x1 * … * exp(bk)^xk since exp(ab) = exp(a)^b. This means that the Beta^X is correct in Figure 4 where Beta = exp(bj) and X is xj.
      2. I don’t understand your question in the second paragraph.
      Charles

      Reply
      • Charles,

        Thank you for your reply. Suppose I transform one or two independent variables via multiple regression. In excel’s data analysis toolpak it spits out the coefficients as those coefficients are transformed. Do I have to transform all of the independent variables, the dependent variable, and intercept -OR- just the two transformed independent variables? Again, I only need to transform two of the independent variables. Lastly, does using the natural log of any independent or dependent variable automatically change the equation to an exponential or power equation?

        Reply
        • Hi Jason,
          1. You don’t need to transform all the variables. You can transform one or more of the independent variables, and optionally also the dependent variable. You can also use different transformations for different variables.
          2. With more than one independent variable, I don’t know whether the term exponential or power equation is used when some variables use a log transformation and others don’t.
          Charles

          Reply
      • Charles,

        I wanted to provide some clarification to my second question.

        When I run the models at work I have Beta Coefficient in one column, the average of each of the independent variables in another column, and the last column has the beta coefficients * (times) the average assumption of that independent variables. When showing the model to stakeholders it helps to have the COEFFICIENTS IN THEIR LINEAR FORM so that they understand for unit change between the two variables. The natural log confuses people who do not understand regression analysis or casual methodology. My previous question was, which variable do I change back? Also, if I changed two independents do I have to change all the independent variables and intercept in the regression analysis output in excel?

        Thank you so so much again for answering my questions. Excellent support and discussion board.

        Jason Richman

        Reply
      • Charles,

        I am following up on my second question. Do I need to transform all the independents, intercept, and y value, if I only use the natural log to transform two variables in multiple regression? In the regression toolpak via excel gives me the transformed regression output. Do I use EXP for all independent variables, intercept, and dependent variable. Again, I only transformed two of the five variables (two independents).

        Reply
    • Jason
      My research is on iput demands estimation of food crops.
      Here i needed to normalized input prices by output prices. And i have taken real values too. Then prices of input showed less than zero values. Transform into log values give negative values. How do i handle this

      Thank you

      Reply
      • The usual approach is to first determine the smallest data value. If this value is -10, for example, then instead of using a log(x) transformation, use log(x+11). Here x+11 > 0 for all data values x.
        Charles

        Reply
  6. Thank you sir for your help. Please can I have clear specifications of linear, double log, semi log and exponential forms.

    Reply
  7. Hello Charles,
    thank you very much for this brilliant material and clear explanation. It is very helpful. I would like to clarify just one question – classic textbooks on statistics and math do not cover the issue of possibility or necessity of including several predictor variables, when some of them are log-transformed, but others – not, could you please recommend a book/ article explaining this issue in detail? I am still not sure when it is possible and when not. Thank you!
    Kind regards
    Helga

    Reply
    • Hi Helga,
      It is always possible to use a log-transformation on one or more of the variables (including the predictor variables). The only limitation that I am aware of is how to handle non-positive data. E.g. for a predictor variable X, if the smallest data value for this variable is -10, then you need to use the transformation log(x+11) so that you are always taking the log of a positive value (here, 11 can be replaced by 10.5, 12, etc.).
      Whether or not it is desirable to use a log-transformation is a different matter.
      In my experience, this subject tends to be discussed more in statistics books for economics, i.e. in econometrics books such as Woodridge, Green e, Gujarati, etc,
      Charles

      Reply
      • Hi Charles, thank you for your quick reply! Yes, log transformation of negative numbers is not possible (only additional transformation may help). Anyway, as far as I know, log transformations are applied either with regard to all variables (so called log-log function, to work with a linearized version of a power function) or with regard to one side, entire one, of the equation (Lin-log or log-lin, to work with semi logarithmic functions). I am not sure how transformation of just one regressor may affect OLS estimators….from mathematical and statistical point of view….It’s clear, that technically it is possible, however what challenges may appear in further interpretations and what are the limitations? Thank you very much for the answer!

        Reply
  8. I was asked to Estimate another logit model by including the natural log of the fare variable
    of a titanic set instead of the original fare variable. The range of the fare variable is between 0 and 512. Since log(0) is undefined, use log(fare + 1) instead and use the I() function when including the logged fare variable in a regression model. so I used the log(td $ fare + 1), but I don’t know how to use the I() function, I was told to use l(m), but I’m still confused. Can someone help me with this because I’m new to all of these?

    Reply
      • Hi Charles,
        Thank you for this post.
        I wanted to understand the interaction term if I have a log-transformed variable and the other one is a level continuous variable(mostly they are proportion like a share of the service sector in total employment). How is the coefficient interpreted and also please tell me is it a good idea to take a log transformation of the ratio/ share variable?

        Reply
  9. Thank you, Charles, for your clear explanation. Am I allowed to transform only certain independent variables in a ln regression model resulting in:
    ln y = b0 + b1 * ln x1 + b2 * x2 + b3 * ln x3

    Thank you!

    Reply
  10. Hello
    I have the linear regression ln(yk)=B0+B1Xk+e and I must regress it using the derivatives to find the formula’s for B0 and B1. is it the same process as if it was level-level instead of log-level or does the log make its way into the new formulas.

    Reply
  11. What do you suppose you would do if you intend to use multiple regression analysis and some of your data is linear but not all of the data is linear?

    Reply
  12. Thanks for this informative and problem solving community.

    Please how can I interpret this question.

    Given the following class of models, how do you interpret them with respect to the dependent and independent variable
    1. Log(Y) = 0.27 + 12.34log(X)
    2. Log(Y) = 3.23 – 0.03(X)
    3. Y = 4.1 – 2.36X
    4. Y = 0.39 + 0.58 log(X)

    Reply
  13. Dear Charles,

    Hello. I found your website very useful. I am a beginner at stats and was able to fit a logarithmic regression of two variables.
    I read through this page to fit multiple logarithmic regression of three variables so from :
    τ = τo + Kγ ̇^n
    τ – τo = Kγ ̇^n
    log⁡ (τ – τo) = log⁡K + n log⁡γ ̇

    To:
    τ = τo + Kγ ̇^n * t^-p
    τ – τo = Kγ ̇^n * t^-p
    log ⁡(τ – τo) = logK + n log⁡γ ̇- p logt

    I have a graph of γ ̇vs t for different sets of chosen τ. I didn’t quite fully understand and was hoping if you could give me some advice or tell me if this is the right page to look at.
    τ1 τ2 τ3
    γ ̇l o / *
    l o / *
    l o / *
    lo_*/________t

    Thanks.

    Reply
  14. Hello,

    My dependent variable was shown to contain heterskedastic errors, however the dependent variable data also contain negative values. If I to need to do the log-transformation in Excel, how would I go about it ?

    Kind Regards

    Reply
    • Hello Enzo,
      If the samllest dependent variable value is say -9, then add 10 to all the dependent variable values and so then you can take the log of all the values.
      Charles

      Reply
  15. Hi Charles ,

    Thank you for your post , it’s very helpful . I was wondering if there is a way to manipulate the predictions in order to fall under the line . I know the purpose of transformation and regression is to get as close to an accurate prediction of Y as possible however what I would like to achieve are predictions that have accuracy however we want the predicitons to be manipulated to fall under but as close to the line of best fit .

    Reply
      • Dear Charles – sorru I wasn’t very clear . So with regression we are of course using the x variables to determine y . The regression model with residuals ( or back testing ) , can show us the difference between predictions and actual . What I am trying to achieve is to predict ( as accurately as possible ) , but include some kind of method to the y formula to push the predictions below the actual , as opposed to merely trying to get as close to the actual as possible . Hope this helps to explain my question .

        Reply
        • Enzo,
          You can do this using Solver. The regression model takes the form y-pred = bx + a where you use Solver to find a and b. For each data element (x_i, y_i), you minimize the sum of the residuals squared where the residual is r_i = y_i – y-pred_i. Now you tell Solver to constrain the solution so that r_i >= 0 for all i.
          Charles

          Reply
          • Dear Charles ,

            Thank you so much for your advice . I hope I’m not asking too much , for you to help me do this using solver in excel ? Ie if I have the regression formula , how do I go about inputting this with the data into solver in excel . I have some experience on regression and your posts are very helpful but little or no experience using solver.

  16. I’m trying to work on multiple regression model, in which there are 4 -5 independent variables and one dependent variable and i would convert the same into log-log transformation.Its a time series data and i would like to know how much minimum time frame to consider if picking annual data i.e. what should be the minimum sample size.

    Reply
  17. Charles,

    This article and comments have been very useful. Thank you for taking the time to do this!

    I had a question no one has asked yet. I found for one of my data points, my best regression result is log(y) = C + .05 log(x) – .000059 log(x^2)

    I haven’t seen an example of this type of equation in regression analysis but it fits my model extremely well. Is this even acceptable? If so, any suggestions on how to interpret the equation?

    Reply
    • Hello Josh,
      Note that .05 log(x) – .000059 log(x^2) = .05 log(x) – .000059(2) log(x) = .049882 log(x).
      Thus, the equation takes the form log(y) = .049882 log(x) + C.
      This is a simple linear equation of the form y’ = ax’ + c where y’ = log(y) and x’ = log(x)
      Charles

      Reply
  18. Hello sir, I’m doing a log-log regression where my equation is of y= a * (x1^b) * (x2^c)
    where a ,b, c are constants .But I need an equation of the form y = a * (1+x1)^b * (x2^c) . This is because my x1 variable varies from 0 to 10 and at x1=o , y becomes a function of x2 only.

    Reply
  19. Hello Sir, could you please help with the interpretation of coefficient of the regressors in the following lin – log model?

    Growth Rate = 15 + 2.5Inflationrate + 5.5LogFDI

    Thanks.

    Reply
    • Hello Ben,
      I am not an economist and so I am probably not the best person to interpret the coefficients from an economic point of view. In any case, here is my best attempt.
      1. Assuming that Inflationrate takes values such as .02 or .03 (for 2% or 3%), then for every increase of 1% in the inflation rate, the growth rate increases by 2.5% (holding LogFDI constant).
      2. We now look at the LogFDI coefficient. Taking the derivative of both sides of the regression equation, we get
      d(Growth Rate) = 5.5(d(FDI)/FDI). Now, 100*d(FDI)/FDI is the change in FDI as a percentage and 100*d(Growth Rate) is the acceleration of whatever the growth rate is measuring (e.g. GDP or revenues). Thus for each 1% increase in the FDI, the growth rate accelerates 5.5 times
      Charles

      Reply
  20. Hi Charles,

    Hope you well.

    What is the strategy for dealing with a model where you have several independant variables but only 1 of the independent variables cannot be successfully linearized by log/square root transformations etc (removing the variable from the model is not desirable).

    I’ve come across a few examples where they run a multiple regression model but the author points out that 1 of the variables cannot be fully linearized but they do not elaborate what to do next after that. they just transform as best as possible and then they give the final results.

    One may find that a non linear least squares method explains the data quite well between that 1 independant variable and the dependent variable (using gauss-newton, newton, levenberg–Marquardt)

    Surely, one does not take the entire model and resort to non-linear least squares because of only 1 independent variable causing the problem.

    What are your thoughts? 🙂

    Kind regards
    Declan

    Reply
    • Hello Declan,
      One of the realities of statistical analysis is that often some amount of judgement is required; i.e. often there are no simple answers. Depending on the details of the problem, I might use the following approach:
      1. I would transform the best that I could and see what sort of results I get. If not too bad, I would be happy with this.
      2. I would use Solver to find the regression coefficients, as explained for Exponential Regression; i.e. use a non-linear model. I could compare the results with approach #1.
      When comparing the predictive powers of the two approaches, I might use Cross-Validation.
      Charles

      Reply
  21. Hi Charles,
    In the estimation of a multiple linear regression model is it right to log transform say just one continuous explanatory variable if the continuous explanatory variables are more?
    Regards!

    Reply
    • Brown,
      You can perform a transformation on only one of the variables. You can also perform different transformations on different variables. The important thing is that all the data for any one transformed variable must use the same transformation.
      Charles

      Reply
  22. Hello..help me solve this.

    You have been provided with the following information in table form
    Input (L) 1 2 3 4 5
    Output(Q) 0.58 1.1 1.2 1.3 1.95

    Fit a cob Douglas function of the form Q=aL^be^u to the data and solve the variance of the regression model.

    Reply
      • Yes.
        This is what I found
        The cobb Douglas dissociates to a linear equation as follows:
        Lin Q=lin a+b lin L+u

        The default regression model is :Y=a+bX+e
        I get confused when i now have to replace the data given to the linear form of the Cobb Douglas function.

        How do i go about??Will the Lin of Q represent the dependent variable Y,and Lin of L represent X??

        Usually,we know that output (Q for our case) is a dependent variable,and input is a an independent variable.

        Thats where the confusion kicks in.Help me determine whether lin Q will represent X or Y from the data given.

        Reply
        • What you are calling Lin Q is usually referred to to as LN(Q), namely the natural log of Q (and similarly for the other variables). This means that you replace the data for the dependent and independent variables by the natural log of these data values. You then perform ordinary multiple linear regression to find the coefficients. The dependent variable Y is LN(Q) and LN(L) is the independent variable X (these can also be multiple variables).
          Charles

          Reply
  23. Hi Charles,
    Thank you very much for the prompt response.
    By surfing here and there on the internet, I have made derivation for my forecast equations as follows. Kindly have a look at it and let me know if it makes sense.

    “In our regression model, both the dependent and independent variables are log transformed and our regression equation is of the following form
    Ln (Y) = C + b*Ln(G)+c*Ln(P)+d*Ln(L) (3.10.1)
    Where:
    Y= Electricity Sale
    C= Constant
    G= GDP
    P= Average Electricity Price per kWh
    L= Lag of the Electricity Sale (Y)
    b,c,d= Elasticities of GDP, Price and Lag respectively

    “In order to derive a general equation for forecasting, we will analyze the impact of one predictor (independent variable) on the response (independent variable) at a time keeping the other predictors at constant value.

    Constant (C):
    The constant also known as the Y intercept is the value at which the fitted line crosses the Y axis. Mathematically, it is described as the mean response value when all the predictors are set to zero. However, a zero setting for all the predictors is often an impossible/nonsensical combination.
    In our regression equations having predictors as GDP, Price and Lag of Sale, the intercept values are not economically meaningful. However, we are not particularly interested in what would happen if all the independent variables were simultaneously zero, therefore, we have left the constant in the model regardless of its statistical significance.
    In order to simplify the forecast equation, we have ignored the constant as its magnitude is very small (less than 1).

    Impact of Predictors (GDP, Price & Lag of Sale):
    In order to see the impact of GDP (G) on the electricity sale (Y), we take two values of G (G1 and G2) and held the other predictors at fixed value, the above equation 3.10.1 yields
    Ln (Y2)-Ln(Y1)=b*(Ln(G2)-Ln(G1)) 3.10.2
    By simplifying
    Ln (Y2/Y1)=b* (Ln(G2/G1)) 3.10.3
    By taking inverse transform
    Y2/Y1= (G2/G1)^b 3.10.4
    Now growth rate is defined as:
    Growth Rate = (Final Value-Initial Value)/Initial Value
    So we can define the growth rate of GDP as
    GR of G = (G2-G1)/G1
    Or
    G2/G1=1+GR of G 3.10.5
    Now putting the value of G2/G1 from equation 3.10.5 in equation 3.10.4 and replacing the Y2 with Yt and Y1 with Yt-1, Equation 3.10.4 can be written as:
    Yt/Yt-1=(1+GR of G)^b
    OR
    Yt=Yt-1*(1+GR of G)^b 3.10.6
    Similarly the impact of Price (P) and Lag of Sales(L) can be derived as
    Yt=Yt-1*(1+GR of P)^c 3.10.7
    Yt=Yt-1*(1+GR of L)^d 3.10.8
    As all our predictors are independent of each other, so we can combine the impact of all the three variables in a single equation.
    Yt= Yt-1*(1+GR of G)^b + Yt-1*(1+GR of P)^c + Yt-1*(1+GR of L)^d
    OR
    Yt=Yt-1* ((1+GR of G)^b)* (1+GR of P)^c)* (1+GR of L)^d ) 3.10.9
    The above equation is known as the general forecast equation.”

    Reply
    • Hi Abrar,
      I have to trust your research into this formula. I am sorry to say that I don’t have the time to investigate it further. Perhaps someone else in the community can comment.
      Charles

      Reply
  24. Good afternoon Professor,

    I’m building a model explaining how different factors affect GDP like this: log GDP = u+ B1*log X1+B2*X2+B3*X3+…+Bn*Xn

    Is there any difference in the robustness test for this model compared to that for other linear models?

    Thank you.

    Reply
  25. Dear Charles,
    I ran a multiple regression with dependent variable as Electricity Sale (Y) and Independent Variables as GDP(G), Electricity Price(P) and the Lag of the Electricity Sales (L) with Log transformation on both sides. As my equation is
    Ln(Y) = C+ aLn(G)+bLn(P)+CLn(L).
    Now after finding the coefficients, a, b, c, I’m given an equation for forecasting in the following form
    Yt=Yt-1*((1+Growth Rate G)^a)( 1+Growth Rate P)^b)(1+Growth Rate L)^c))

    Where:
    Yt=Electricity Sale of current year
    Yt-1=Electricity Sale of previous year
    Growth Rate is give in percentages like 0.05

    I don’t know how this equation is derived? and why is that constant term C omitted?

    Reply
  26. Hi Charles,
    I made Lambda scaled power transformation of my dependent variable (y) and fitted model in different functional form with the independent variable (x), and found best fitted (p0. In my case, some values of y are already in negative by the lambda scaled power transformation, so it provided the model summary accounting only positive values of y. Therefore, what could be the solution to appropriately find r-squared value in my case? or how can I make this model into a linear function with accounting all values of the dataset?
    Note: both y and x are continuous variables, values range from 0.1-0.9 (gram) and 5-25 (degrees C) respectively. The reason I applied initial Lambda scaled power transformation is as it best satisfied with all the normality and homogeneity residual variance assumptions than with original and other transformations.

    Thanks !

    Reply
    • I don’t understand transformations you made. If you send me an Excel file with your data and the transformations you made I will try to answer your question.
      Charles

      Reply
  27. Hi, I would like to know if it is possible to use Log10 transformation in the independent variable (in my case ocean depth from 0 to 2000) to explain growth rates (% body weight/day going from 0.1 to 6). I did the regression using the values (G= b-a*Depth) and I had a weak relationship R²=0.18. But when I do the regression (G= b-a*Log10[depth]) my R²=0,67. Is it acceptable, how can I explain why I did the transformation?
    Thank you very much for this blog!!

    Reply
    • Richard,
      It is common to make such a transformation. I would graph the transformed data values (as a scatter plot) to make sure that the points more or less line up on a line.
      Charles

      Reply
  28. Hi,
    My data contains one dependent variable and 10 independent variables (n=720) from an experimentally designed plot. My data are all positive. The value of dependent variable ranges between 0.17-o.89. Values of independent variables varies:
    1) Continuous X1 (20-70%), X2 (0.11-1.4), X3 (3-30%), X4 (9-18), X5 (6-60%), X6 (1-5), X7(5-46), 2) Categorical X8 (4 levels), X9 (3 levels), X10 (5 levels)

    I tried model with some variables and found deviation from normality assumption of multiple regression.

    Question 1:
    What type of transformation is good for my dataset as my indepdent variable contains both continuous and categorical data. It means, for what variables do I need to use log transformation as there are different range and scale of data values?

    I tried to fit the model with all independent variables and found 6 of them are not significant. Through model selection, eliminated non significcant variables and finally, got model with all 4 significant variables (two continuous and two categorical). I diagnosed that final model, and found it was not satisfied with linearity, normality, homogeneity of variances. Now I would like to make an appropriate transformation for my model.

    Question 2:
    When shall I perform transformation, at the begining (before elemination of non significant variables) for the model that contains all the variables or at the end (after elimination of non significant variables) for the model that contains only significant variables?

    I would appreciate any suggestions on these two questions. Thank you !
    Regards’
    Mkc

    Reply
  29. Good evening

    I have a question for my multiple regression analysis. Does someone can help me with that?
    I’m predicting the GDP of a country using different factors. I’m planning to use the following model (hightes r square).
    log(y) = β0 + β1 * log(Xi1) + β2 * Xi2 + … + βn * Xn + ε; in other words: is it possible to do a log – log transformation without transforming all the independent variables?

    Jeroen

    Reply
  30. Hello,
    I am working on a level-log model. But I wonder how to obtain the related prediction equation from the slope and intersection as AA38 or AA39 in Fig. 7? After tests, the equation y=a+b·ln(x)+c·ln(y) proposed by a reader in the comment was not working. Could you show me the prediction equation from the slope and intersection for a level-log model?

    Thank you very much,

    James

    Reply
    • James,
      Since your regression takes the form y = b * ln x + a, you can view this as the simple linear regression y = b * z + a where z = ln x. You can use Excel’s TREND to predict the value of y based on any given value of z. Suppose you want to predict y for the x value x0. All you need to do, is use TREND to predict the value of y when z = ln x0; i.e. first take the log of your x0 value and then use TREND to forecast y.
      Charles

      Reply
      • Charles,
        Finally, I calculated y by y=b0 + b1*ln x1 + b2*ln x2 + b3*ln x3 +b4*ln x4 + b5*ln x5. I got a better fitting from the level-log model than the log-log model. Then I applied the prediction equations of these two models to another data for prediction. Somehow I got many negative numbers in prediction in the level-log model that is very different from the log-log model. The maximum in the level-log model is much smaller than the log-log model. The prediction of the level-log model in new data is worse than the log-log model. I wonder why this result is possible?

        Thanks much,

        James

        Reply
          • Charles,

            I expected a better model obtained from data A would have a better prediction in data B with the same equation. Do you think this is a correct concept? I got a completely different result so I raised the question.

            Thanks,

            James

  31. hello,
    how to determine the coefficients ( c; b1; b2 and b3) for this regression model: log(Y) = c + b1*log(x1) + b2*log(x2) + b3*log(x3).
    thanks

    Reply
  32. hello,
    do you know how to interpret the figures?
    my equation using log is:
    log(Y) = c + log(x1) +log(x2) +log(x3)
    i ran the regression on Eviews but i do not know how to interprete my coefficients. please help. thank you.

    Reply
    • Shahanah,
      I presume the regression model is log(Y) = c + b1*log(x1) + b2*log(x2) + b3*log(x3)
      Taking the exponential of both sides of the equation yields y = e^c * x1^b1 * x2^b2 * x3^b3.
      E.g. if you double x1, then the new y will be 2^b1 time previous value of y.
      Charles

      Reply
    • LN(x) is the natural log of x and LOG(x,b) is the the log of x base b. Note that LN(x) = LOG(x,EXP(1))
      Generally the natural log is used, although you could really use log to any base.
      Charles

      Reply
  33. is it possible to apply logs to the regresand and not on all the regressors. because other regressors are negative and a log cannot be negative. for example log(exchange_rate)=B+log(oilprices)+interest_rates.
    is the model above correct or not.

    Reply
      • Hello, Charles.

        adding to the previous question. In a Log-log regression if you are applying only to 2 independent variables the logarithm, then how you can read the results.

        I mean, the coefficient of the variables with logarithm are in percentages and the coefficient of the variable without the Log are in monetary units?

        Reply
  34. Charles, thank you so much for your knowledge sharing!
    Got a question, I have gone over this article and tried to come up with an level-log equation like you did with $T$7*$S$7^W14*$R$7^X14 (Fig 4) for log-level and with EXP($J$51)*EXP($J$52)^LN(W38)*EXP($J$53)^LN(X38) (Fig. 7) for log – log.
    Any suggestions would be highly appreciated.

    Reply
  35. Thanks for this information.

    Wondering about your cell references in Figure 7. Is it possible that the references to cells J56, J57, J58 in Figure 7 should actually refer to the coefficients in cells J51, J52, J53 in Figure 6?

    Reply
    • Yes, you are correct. Actually, these formulas refer to the exponential of the values in cells J51, J52, J53 of Figure 6.
      Thanks very much for catching this mistake. I have now updated the referenced figure to reflect the change.
      Charles

      Reply
  36. Sir, what if even after taking log data is not normal…..then how to make data normal?….I m having hard time please let me know. Can i take log of already log series …is it ok for making data normal.

    Reply
  37. I am using 2 stage least square ans seemingly unrelated regression, where I have 12 independent variables. I am planning to use log value for dependent variable and only two independent variables among the 12 independent variables. It is not fully likes log-log regression. Would you please tell me can I do it and if I can, how I can refer the name of this type of model?
    I would appreciate any help on this.

    Reply
    • Shampa,
      I don’t yet support 2 stage least squares, and so I don’t have any advice about this topic at this time.
      Charles

      Reply
  38. Hello Charles
    If there is a zero value in the independent variable, how can we go ahead with the log transformation in the log-log model?

    Thanks

    Reply
    • Use log(x+a) instead of log(x) where a is a constant big enough so that x+a is always positive (for the values of x that you are considering).
      Charles

      Reply
    • Angela,
      I don’t really know how to answer this question. They have practical application and are an interesting subject in statistics.
      Charles

      Reply
  39. Hello Charles,

    I am running two OLS models. Model 1 is a liner model and in model 2 i log my outcome variable y.

    When I ran the regression using model 1 it shows that my explanatory variable x has a positive and significant effect on y. Then when I ran the model using the log form (i.e., ln(y)) my explanatory variable becomes negative and insignificant.

    I am having a hard time understanding why in model 2, my x variable becomes negative and insignificant? Not sure how what is the correct interpretation here. Any suggestions?

    Thank you!

    Reply
    • It is difficult for me to answer your question without seeing the data. Perhaps the assumptions for an OLS model are not being met with one of these scenarios. If you send me an Excel file with the data, I will try to see why this is occurring.
      Charles

      Reply
  40. Hi Sir,

    Could I ask for a bit of help? What kind of fitting should I use if I have a log-log plot of two independent variables (x and y have been measured with error)?

    Thanks so much

    Reply
  41. This post helped me work through issues I was having with a log regression. Love your site, your posts and examples are detailed and easy to implement. Thank you!

    Reply
  42. Hello SIr, i am implementing a log transfromation on OLS regressioni.e Log transformation on multiple regression. But among the 3 types of log transformations namely log-level,level-log and log-log, which transformation should i go with? Is log-level similar to box cox transformation?

    Reply
    • There are many types of transformations in addition to the ones you have referenced. The specific transformation depends on your data. Usually you are picking the transformation that achieves some objective (e.g. making the data more linear or making the data better fit the normal distribution).

      The log-linear (i.e. log-level) transformation is one of the transformations in the Box-Cox family of transformations.

      Charles

      Reply
  43. Daniel,

    If I only had one independent variable I could do a scatter plot against the dependent variable to visually determine whether the relationship is linear, and if not, whether a transformation (log, ln, 1/x, etc.) is appropriate. but when I have multiple independent variables (say 3 o 4) in a multiple regression, what’s the best way to test for linearity, and what if some are liner and others curves (e.g. exponential)? Thanks

    Reply
    • Adeeb,
      I tend to simply perform the multiple regression analysis and see if I have a good fit (based on the value of R-square and the significance of the correlation coefficients). You can compare difference transformations in this way as well.
      Charles

      Reply
  44. If I am doing a multivariate regression, but on my left hand side of the equation some of my independent variables have values in thousands which are much higher compared to the others having absolute values in range of, say, 0 to 100, should I use log for all of them or just for the ones with the high values so they can be put on the same level? Also, if some of my variables are in percentages, is it ok if I still apply the log on to them?

    Thank you very much!

    Reply
    • Daniel,
      You can use log for these, but you also might be better off not doing so. The important thing is not that absolute values be on the same scale, but that the assumptions for multiple regression be satisfied (linearity, normality, homogeneity of variances). If using the log contributes to this then using the log can be a good idea, otherwise it is better not to use the log. You can use log for some variables but not others.
      Charles

      Reply
  45. I am trying to build a forecasting model using multiple regression, can you have a look at it and tell me if I am doing it right?.

    I would appreciate any help on this.

    Regards,

    Anil

    Reply
    • Anil,
      I don’t generally do this sort of thing since it can be very timeconsuming. If you send me your model I will take a quick look, but I won’t be able to try to decipher things.
      Charles

      Reply

Leave a Comment