Overview
We now show how to use Real Statistics capabilities to test the following assumptions for Two-Factor ANOVA:
- All samples are drawn from normally distributed populations
- The samples have a common variance
- There are no outliers that distort the test results
By sample, here we mean each combination of levels from the two factors.
Although the normality assumption is often stated as above, in reality, the normality assumption should be stated as follows:
- The residuals for the ANOVA data are normally distributed
Here, the residuals and how to test them for normality are addressed in Normality Testing of Factorial ANOVA Residuals.
Testing the other two assumptions is addressed in Homogeneity of Variances and Testing for Outliers. These tests require that the data be formatted differently from the Excel and stacked input data formats that we use for two-factor ANOVA. This webpage shows how to convert these formats into the formats required to test homogeneity of variances and outliers (essentially, the Excel one-factor ANOVA format).
Example
Example 1: A firm is trying to decide on its strategy for a new product that it wants to launch. It managed to make estimates of the profitability of the new product based on two factors: the Quality of the product (High or Low) and the Distribution Channels (Direct, OEM, or Resellers). Based on the data in Figure 1, determine whether there are significant differences between these approaches.
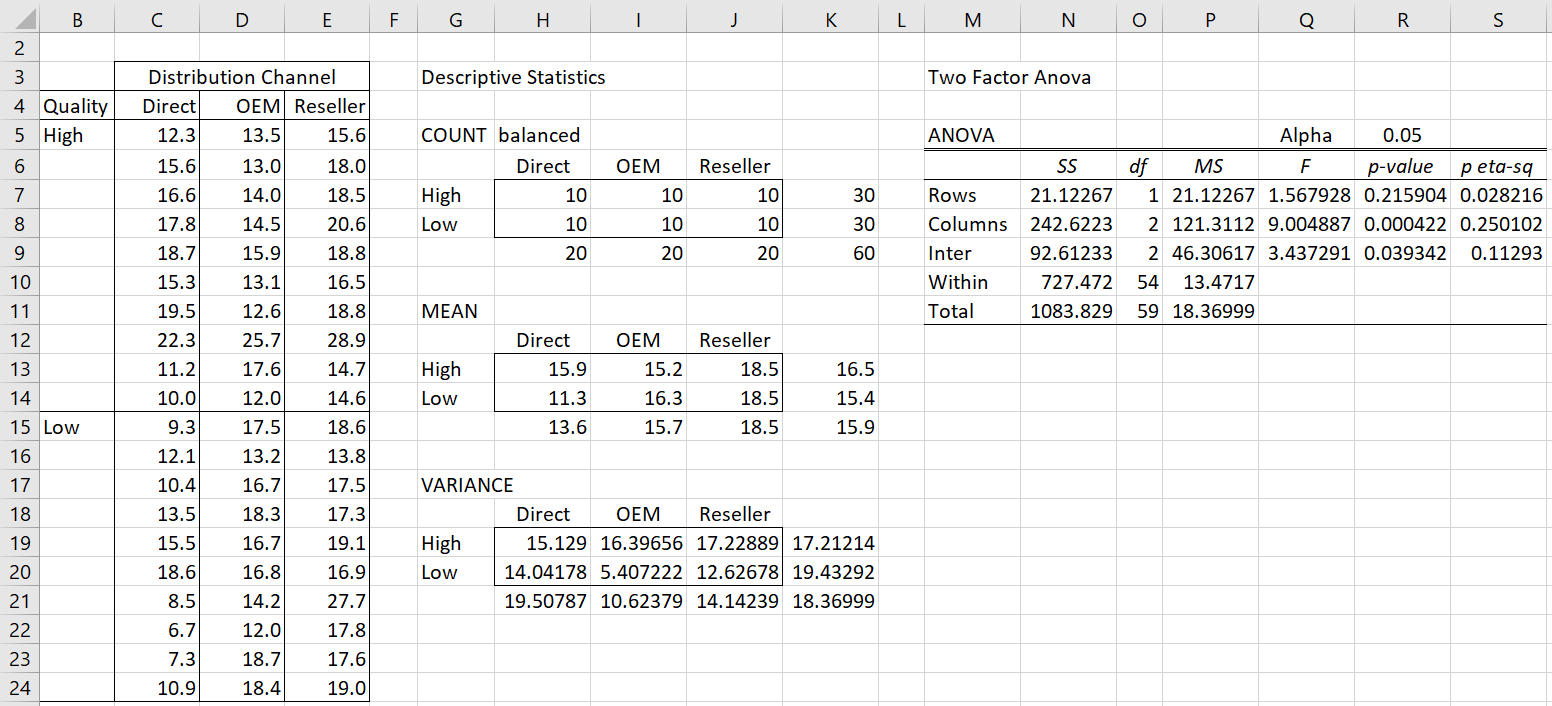
Figure 1 – ANOVA for Product Strategy
We can see from Figure 1 that there is a significant difference between the distribution strategies and in the interaction between quality and distribution, but not between high and low quality. But before we actually conduct the analysis, we should check the key assumptions. To make it easier to do this, we reformat the input data as described below.
Reformatting the Data
Press Ctrl-m and double-click on the Analysis of Variance option. Select the Two Factor Anova option from the dialog box that appears, and then fill in the subsequent dialog box as shown in Figure 2, entering B4:E24 in the Input Range field, choosing the Reformat option and entering 10 in the Number of Rows per Sample field.
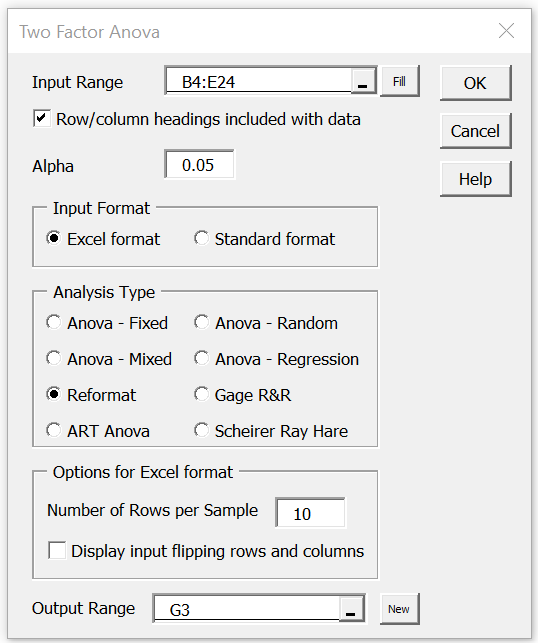
Figure 2 – Reformatting Two Factor ANOVA data
After clicking on the OK button, the output shown in Figure 3 appears.
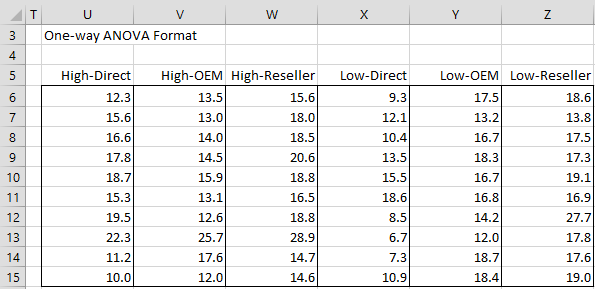
Figure 3 – One-way ANOVA Format
Descriptive Statistics
We can now perform a variety of tests on the data in Figure 3. First, we will use the Descriptive Statistics and Normality data analysis tool, choosing the Descriptive Statistics, Box Plots, Shapiro Wilks and Outliers and Missing Data options. The results are shown in Figures 4, 5, 6 and 7.
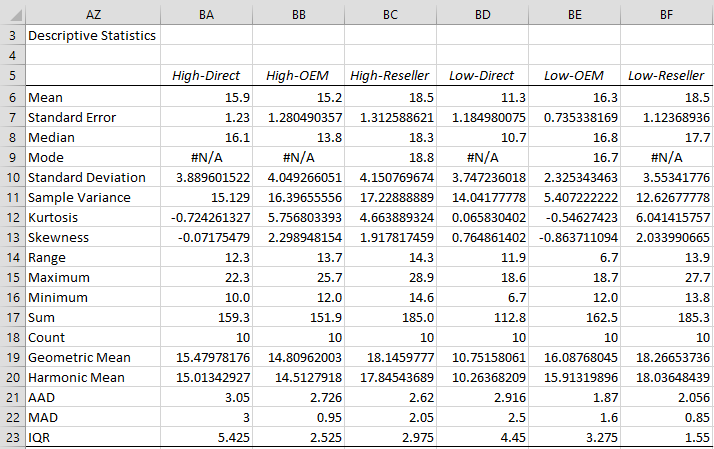
Figure 4 – Descriptive Statistics
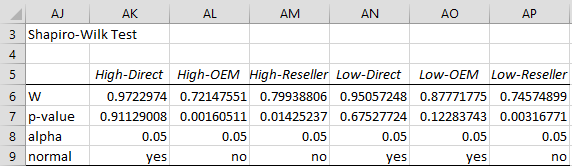
Figure 5 – Shapiro-Wilks Test for Normality
Box Plots and Outliers
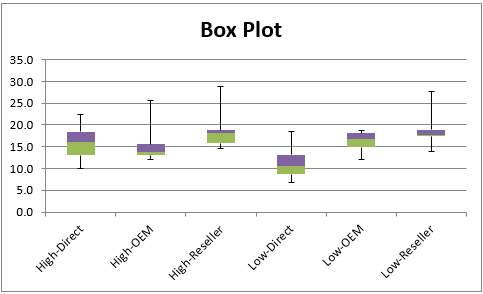
Figure 6 – Box Plots

Figure 7 – Outliers and Missing Data
Any entry in Figure 7 that is larger than 2.5 or smaller than -2.5 is considered to be a potential outlier.
Testing for Normality and Outliers
We see from the Shapiro-Wilk test that High-Direct, Low-Direct, and Low-OEM are normally distributed. We hope that the other three groups are at least symmetric. From the Descriptive Statistics, we see that the Mean and Median are fairly similar (especially for Low-Direct and Low-OEM), which is a good indicator of symmetry, but we also see that these groups have quite high kurtosis and higher-than-desirable skewness, which is inconsistent with symmetry. This is confirmed by the Box Plots.
The Outliers and Missing Data show no missing data, but three potential outliers: data element 7 in Low-Reseller and data element 8 in High-OEM and High-Reseller. These correspond to cells E21, D12, and E12 in the original data. None is that high, but they should be checked further.
Normality of Residuals
As explained above, we should really check the normality of residuals rather than the individual group data.
In Figure 8, we display the residuals for the data in Figure 1 (although to save space we omit rows 26-33 and 37-62) using the array formula =Anova2Res(Anova2Std(B4:E24,10)) as described in Normality Testing of Factorial ANOVA Residuals. In addition, we use the Shapiro-Wilk test to determine whether the data is normally distributed and Outliers and Missing Data to highlight potential outliers.
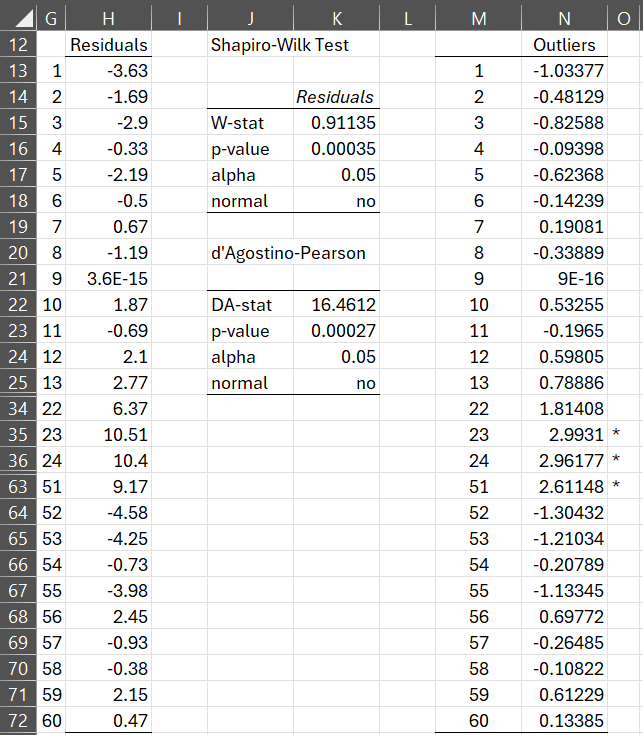
Figure 8 – Normality of Residuals
Figure 8 presents a clearer picture of the situation. First of all, we see that the residuals are not normally distributed. Furthermore, there are three potential outliers (the same as in Figure 7).
Homogeneity of Variances
Regarding homogeneity of variances, we use the Levene’s Test option from the One-Factor Anova data analysis tool on the data from Figure 3. The result is shown in Figure 9.

Figure 9 – Levene’s Test
We see from Figure 9 that the homogeneity of variances assumption is satisfied. This is confirmed by looking at the variances in range H19:J20 of Figure 2.
Example with data in stacked format
Example 2: The approach used in Example 1 can also be used with data that is in stacked format. We now show how to reformat the data in range B3:D20 of Figure 10 into Excel two- and one-factor ANOVA formats.
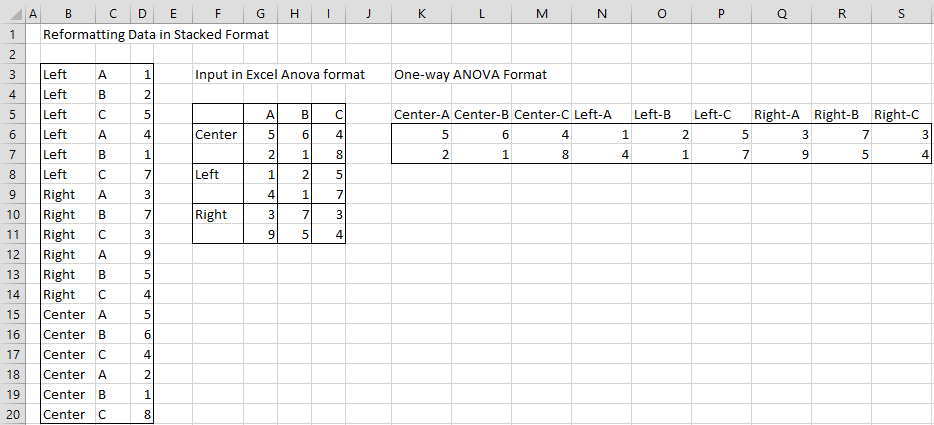
Figure 10 – Reformatting data in stacked format
Press Ctrl-m and double-click on the Analysis of Variance option. Select the Two Factor Anova option and then, in the subsequent dialog box, enter B3:D20 in the Input Range field of the dialog box that appears (as shown in Figure 2), uncheck Column/row headings included with data, and choose the Reformat option.
The results are shown on the right side of Figure 10. Range F5:I11 contains the input data reformatted in Excel two-factor ANOVA format, which is then converted to Excel one-factor ANOVA format in range K5:S6.
Links
Examples Workbook
Click here to download the Excel workbook with the examples described on this webpage.
Reference
Howell, D. C. (2010) Statistical methods for psychology (7th ed.). Wadsworth, Cengage Learning.
https://labs.la.utexas.edu/gilden/files/2016/05/Statistics-Text.pdf
It’s very useful!
My question:
Can we use residuals to check these assumptions?
Using residuals seems more efficient than using original data. For example, we can pool the residuals to check normality rather than checking it one group by one group.
Xi,
ANOVA is effectively regression and so it is sufficient to test the residuals are normally. See
https://www.real-statistics.com/multiple-regression/anova-using-regression/
Charles
Xi,
ANOVA is effectively regression and so it is sufficient to test the residuals are normally. See
https://www.real-statistics.com/multiple-regression/anova-using-regression/
Charles
Great thanks!
Dear Charles, first thanks for your great work, it is very helpful. I have a question concerning violation of homogeneity of variance in case of a dataset to be analysed by Two-Way ANOVA. My experiment is balanced (3 independent replicates for each group) and factorial (FACTOR 1: Treatments, FACTOR 2: Time with 3 levels) and the Levène’s test gives a significant result.
As I read throughout your website, it is not possible to conduct a Welch’s ANOVA for a Two-Way ANOVA, so I tried to transform the data without success.
What should I do in this case? Do you think that going on anyway with Two-Way ANOVA (and if significant, with Tukey Post-Hoc test) gives too wrong results?
Dear Liza,
1. I have provided two non-parametric versions of two-factor ANOVA on the website
https://www.real-statistics.com/two-way-anova/scheirer-ray-hare-test/
https://www.real-statistics.com/two-way-anova/aligned-rank-transform-art-anova/
The first handles non-normality but not heterogeneity of variances. The second might be useful.
2. A third choice is to perform resampling. Resampling for one-way ANOVA type situations is described at
https://www.real-statistics.com/one-way-analysis-of-variance-anova/resampling-anova/
I have not yet implemented resampling for two-factor ANOVA and don’t know how well it handles the interaction of factors. In any case, here is a reference I found on the Internet, although I have not read this paper myself:
https://www.researchgate.net/publication/262247515_A_parametric_bootstrap_approach_for_two-way_ANOVA_in_presence_of_possible_interactions_with_unequal_variances
3. If you aren’t interested in the interaction of the two factors then you can run separate one-way tests, including Welch’s ANOVA and Games-Howell.
4. Since you probably are interested in the interactor of the factor, I would try to use the usual two-way ANOVA followed by a post-hoc test, whether or not the ANOVA results are significant. In this case, you should try to use a post-hoc test that does not require equal variances. Games-Howell is the usual choice here. I haven’t yet implemented it for two-factor ANOVA.
Charles
Thank you for your time and suggestions!
Because I’m not familiar with bootstrapping I’m going to try ART ANOVA and I will compare the results with those obtained with Two-Way ANOVA analysis followed by Games-Howell post-hoc test (hoping results are not too different).
Hello,
I have used Games-Howell and got a negative p-value result with absolute value less than alpha. Does it mean I got significant results? Also, References and Comments sections in https://real-statistics.com/one-way-analysis-of-variance-anova/unplanned-comparisons/games-howell-test-2/ are missing.
Thank you!
Hello Mayi,
The only negative result you should get is one that is essentially zero (which is a significant result). E.g. -2.4E-10.
Any other negative value is probably a calculation error.
Charles
In the meantime, I tried to better understand these concepts by searching on your website.
If I have correctly understood, before performing an ANOVA One factor or Two factors:
1) first I have to check for normality with the available normality tests (Shapiro with at least 3 replicates and up to 50; D’Agostino with n >50)
2) I have to check for homogeneity of variances (Levène’s test for example with also evaluation of symmetry)
3) IF normality is violated I have to transform ALL my data in my groups; if transformation can’t give normality, then I proceed with a NON PARAMETRIC TEST (For One Way ANOVA, I don’t know for Two Way ANOVA)
4) IF variances are not similar, then I can use Welch’s ANOVA (For One Way ANOVA, I don’t know if it’s also true for Two Way ANOVA) and subsequently I can use a follow-up test such as Tukey HSD (also for Two Way ANOVA?)
But what I didn’t understand is how to analyze my data for normalization. I mean, I have 3 groups with 3 replications each, analyzed at only one time point.
Do I have to write my data into a SINGLE COLUMN one after the other (hence, without specify any group), or it’s correct to write them by groups (first column with 3 replicates of my first treatment, second column with 3 replicates of the second treatment, third column with 3 replicates of the third treatment)? In addition, I also found that kurtosis can’t be calculated for samples with n = 3.
Thank you again.
Hello Matteo,
1) Unless there are a lot of repetitions Shapiro-Wilk is the better test for normality. Shapiro-Wilk will handle sets with up to 2,000 elements (see the Royston version described on the Real Statistics website and supported by the Real Statistics software.
2) Correct
3) There really aren’t very good non-parametric versions of two-way ANOVA (although one of these is described on the Real Statistics website). Alternatively you can use resampling.
4) Welch’s is a good choice for one-way ANOVA. The better follow-up test with unequal variances in Games-Howell.
5) You don’t test all the data together. You need to test each group separately for normality. Don’t expect too much from any of these tests if the sample size is so small (3 elements). Shapiro-Wilk will test a 3-element data set.
Charles
Dear Charles, many thanks for your time in giving me an answer. I very appreciated it and thanks to you and your great website I can handle and understand more easily the statistics.
So, I realized that I was wrong in applying the normality tests to my data sets. In particular, I didn’t organize my data by sample groups (for example, by treatment alone or by treatment at a given time point), but now it’s clearer. My experiments usually involve analysis of data representing values of gene expression of a given gene following a particular treatment at given time points. The number of biological replicates per group, in my experiments, is usually 3 and are not paired. So, for example, I have 3 treatments, each with 3 biological independent replicates, whose gene X expression is measured at 3 time points, in separated culture plates (one plate per time point). So, I will have a total of 3x3x3 = 27 samples.
Example: TREATMENT 1-1h; TREATMENT 2-1h; TREATMENT 3-1h; TREATMENT 1-2h; TREATMENT 2-2h; TREATMENT 3-2h; TREATMENT 1-3h; TREATMENT 2-3h; TREATMENT 3-3h.
Therefore, in this case, I would:
1) Test for normality with Shapiro test and if a sample group is not normal I should evaluate symmetry and kurtosis (in Excel symmetry and kurtosis formulas do not work with 3 replicates, any suggestion to overcome this problem?), alternatively I could try to transform ALL the data in my sample groups.
2) IF after transformation my data are still not normal, then I can consider that ANOVA is robust to violation of normality in case of equal sample size (balanced).
3) Then I can proceed with evaluation of homogeneity of variance with Levène’s test and, if not significant and in case of confirmed normality I could go with Two Factor ANOVA+Tukey HSD post-hoc;
if significant, I can perform Welch’s ANOVA (for data that in case of equal variances would be analyzed with One factor ANOVA). I didn’t understand why Welch’s ANOVA is not ok also for a Two Factor ANOVA and why should I go directly to Games-Howell post-hoc. I know (but, please, correct me if I’m wrong) that post-hoc tests can be performed only after a significant omnibus test (such as ANOVA or also Welch’s ANOVA) has been performed.
4) I understand that Games Howell test can be performed in case of unequal variances and unequal sample size. But, in case of equal sample size (as it is in my situation : 3 for each group) and in a situation like this one, with 2 factors to be analyzed (treatments and time (3 time points)), why can’t I use the Welch’s ANOVA first and after that the Tukey HSD post-hoc test?
5) Last thing, I guess that, after transformation of my data to make them quite normal (for example when a sample group results not normal and not symmetric over all the other groups that, instead, resulted normal) I should represent in a final graph the transformed data with the corresponding error bars and the statistics, instead of representing the original data, isn’t it? In addition, if I represent in a graph the transformed data of a given gene (whose sample groups were confirmed to be not normal), I guess I cannot represent another gene (whose sample groups were instead confirmed to be normal and so transformation was not necessary) by using its original untransformed data. This sounds a little tricky for me, so I guess that simply I could ignore assumption of normality, considering that ANOVA is robust in case of equal sample size.
Hi Charles, I often have to analyze gene expression data. I have 3 biological replicates for each treatment (4) and 3 time points. Data were collected independently, with a total of 36 samples). So, I guess the right test could be the TWO FACTOR ANOVA.
I have the following questions:
– when I test for NORMALITY and HOMOGENEITY of VARIANCES, I often find my data to be NON NORMAL and NON HOMOGENEOUS. Maybe this could be because of the small number of replicates (3)?
– I could transform my data but: 1) do I have to make transformations for all groups? 2) then do I have to represent the transformed data or the original data in the bar graph?
– If, after transformation, my data are still non normal is it possible to conduct Two Factor ANOVA anyway?
I know that ANOVA is a robust test concerning violations of normality, but I dont’ know to what extent and I don’t know about violations of homogeneity of variances..
Do you think that conducting Two Factor ANOVA anyway is incorrect?
Thank you for your great job and your time.
Matteo,
Anova is more sensitive to violations of homogeneity of variances than normality. You might consider skipping ANOVA and going directly to the Games-Howell post-hoc test.
The different groups should undergo the same transformation if you want to compare them
When you say that you have 3 time points, does this mean that you have 3 replicates in 4 treatment groups, and each of the 12 subjects is observed in 3 different time periods? If so then you need to use repeated measures Anova and not ordinary Anova.
Also, see my response to your second comment.
Charles