We now show how to perform Contrasts and Tukey HSD follow-up analyses for three-factor ANOVA in Excel using Real Statistics capabilities. The approach described can actually be used for any type of ANOVA and is not restricted to three-factor ANOVA.
Data Analysis Tool
Real Statistics Data Analysis Tool: The Real Statistics Resource Pack provides the ANOVA Follow-up data analysis tool, as demonstrated in the next example. This tool can be used with both balanced and unbalanced models. We first note that this data analysis tool only uses descriptive data and the values of MSE and dfE created by an omnibus ANOVA data analysis tool.
In Example 1 of Real Statistics Support for Three-Factor ANOVA, we found that the A × C interaction was significant. We now describe how to use Tukey’s HSD to determine which of the pairs have a significant difference in their means. Figure 1 shows a portion of the output from the Three-Factor ANOVA data Analysis tool.

Figure 1 – Three-Factor ANOVA
As we can see from cell S9, the A × C interaction is significant, and so we want to determine which of the interactions (shown in range F15:H20) are significant. We use the Tukey HSD test as follows.
Tukey HSD Test
Press Ctrl-m and double-click on the Analysis of Variance option in the dialog box that appears (or click on the Anova tab if using the Multipage user interface). Next, click on the Anova Follow-up option in the dialog box that appears. Next, fill in the dialog box that appears as shown in Figure 2, and press the OK button.
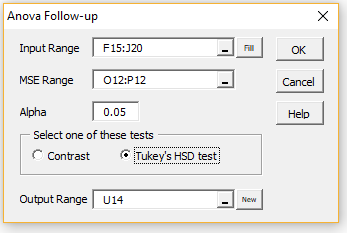
Figure 2 – ANOVA Follow-Up dialog box
Note that we insert the range F15:J20 to capture all the required data about the A × C interaction (including factor labels, counts, and means). If we were interested in the main effects B, we would choose G6:J7 (or equivalently F6:J7). If we were interested in the A × B × C interaction, we would choose range F27:J38.
Results
After pressing the OK button, the output shown in Figure 3 is displayed (although initially the shaded cells in range X16:X21 are all blank and many other cells have error values). As usual, we insert a +1 in one shaded cell and a -1 in another. The selection made in Figure 3 compares the means for Male × Seated with Male × Standing.
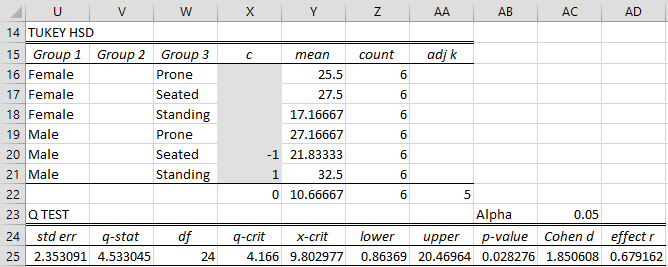
Figure 3 – Tukey HSD analysis
The p-value of 0.028 indicates there is a significant difference between Male × Seated and Male × Standing. We would need to repeat the insertion of +1 and -1 in any other pairs that we are interested in. As described in Tukey HSD for Two Factor ANOVA, we should avoid confounded comparisons. Thus, we can place contrast weight entries in cells X16 and X18 (or X17 and X20), but not in X16 and X20.
If we complete the analysis for A × C, we would find that among all unconfounded comparisons, Seated vs. Standing for Males (p = .028), Seated vs. Standing for Females (p = .035), and Males vs. Females for Standing (p = .00098) are the only significant results. The other 6 unconfounded comparisons are not significant.
ADJK Worksheet Function
All the formulas used in Figure 3 are similar to those described in Tukey HSD for Two Factor ANOVA, although we needed to expand the Real Statistics function ADJK (i.e. adjusted k) to three factors. In particular, cell AA22 contains the formula
=ADJK(COUNTAU(U16:U21),COUNTAU(V16:V21), COUNTAU(W16:W21))
which is equivalent to =ADJK(2,0,3). We can ignore the 0 argument, and so, as we have seen in Tukey HSD for Two Factor ANOVA, ADJK(2,3) = 5.
When analyzing the A × B × C factor, we will need the following expanded definition of ADJK.
Real Statistics Function: The Real Statistics Resource Pack provides the following function.
ADJK(a, b, c) = adjusted value of k based on three factors, one with a levels, one with b levels, and one with c levels
Note that among the C(abc, 2) possible pairwise comparisons, there are abc(a + b + c – 2) / 2 unconfounded comparisons. ADJK(a, b, c) = the value k such that C(k, 2) = abc(a + b + c – 3) / 2 (or at least is close to it).
Contrasts
We can also perform contrast analysis using the ANOVA Follow-up data analysis tool. The approach begins as for Tukey’s HSD, except that we choose the Contrast option instead of the Tukey HSD option in Figure 2. When we press the OK button, the output shown in Figure 4 appears (except that the shaded cells in range X3:X8 are all blank and many other cells have error values).
We now fill in contrast weights as shown in range X3:X8 of Figure 4, which results in the analysis shown in the rest of the figure.
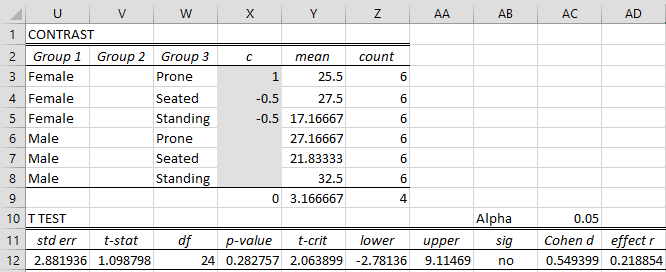
Figure 4 – Contrast analysis
Here we are comparing Female × Prone with the average of Female × Seated and Female × Standing, and see that there is no significant difference. The formulas used in Figure 4 are similar to those employed in Contrasts for Two Factor ANOVA.
As described in Contrasts for Two Factor ANOVA, we avoid confounded contrasts. Thus, we can place contrast weight entries in cells V3 and V6 (or V3, V5, V6, and V8), but not in V3 and V7.
Links
Examples Workbook
Click here to download the Excel workbook with the examples described on this webpage.
References
Bao, J. (2021) Two-, three-, and four-way ANOVA
https://sites.pitt.edu/~jub69/material/material/stat1301/Lec/SAS-ANOVA-2.pdf
Laerd (2024) Three-way ANOVA in SPSS statistics
https://statistics.laerd.com/spss-tutorials/three-way-anova-using-spss-statistics.php
Denham, S. (2020) Three-way ANOVA and adjusted Tukey comparisons
https://communities.sas.com/t5/Statistical-Procedures/Three-Way-ANOVA-and-Adjusted-Tukey-Comparisons/m-p/642241#M30728
Rosenholtz, R. (2004) Two-way ANOVA, II
No longer available online