Testing for outliers
We have the following ways of identifying the presence of outliers:
- Side-by-side plotting of the raw data (histograms and box plots)
- Examination of residuals
Residuals are defined as for Levene’s test, namely:
![]()
The residual is a measure of how far away an observation is from its group mean value (our best guess of the value). If an observation has a large residual, we consider it a potential outlier. To determine how large a residual must be to be classified as an outlier, we use the fact that if the population is normally distributed, then the residuals are also normally distributed with distribution
eij ∼ N(0, MSW)
Thus approximately 4.56% of the observations should be more than 2 standard deviations away from its group mean, 1.24% should be more than 2.5 standard deviations away, 0.26% should be more than 3 standard deviations away, etc. Any deviations from these norms can be viewed as indicating the presence of potential outliers.
Example
Example 1: Determine whether there are any outliers for the data in Example 2 of Basic Concepts for ANOVA if we change the first sample for Method 4 to 185 (instead of 85).

Figure 1 – Identifying outliers (part 1)
In Figure 1, we calculate MSW as we did in Example 3 of Basic Concepts for ANOVA. From this, we calculate the standard error sW = SQRT(MSW) = 24.2.
Since residuals are presumed to be normally distributed with mean 0 and standard deviation sW, we can standardize the residuals to obtain the results in range B21:E28. For example, cell B21 contains the formula =(B4-B$12)/$F$16.
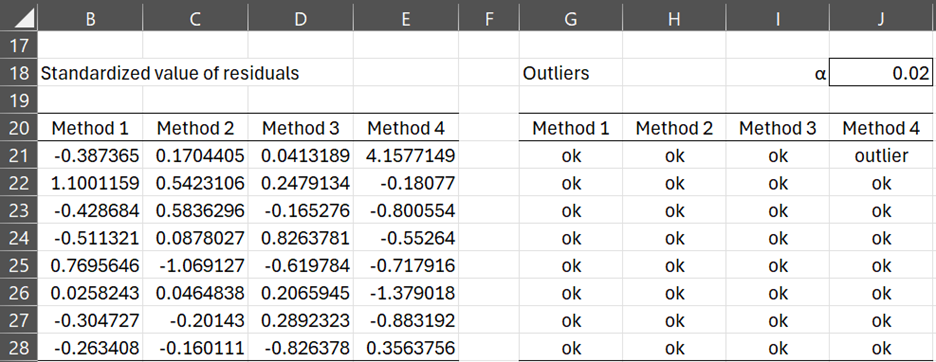
Figure 2 – Identifying outliers (part 2)
We define an outlier based on an alpha value. Here we choose α = .02, and so we label any of the original data items as an outlier if its standardized residual has a normal value in the critical range defined by alpha.
E.g. we see that the first sample element for Method 4 is labeled an outlier (in cell J21) since NORM.S.DIST(ABS(E21),TRUE) = NORM.S.DIST(4.16, TRUE) > .99 = 1 – α/2.
Dealing with outliers
Once a potential outlier has been identified, first check the data to make sure the outlier is not a data entry or data coding error. If not, you can conduct a sensitivity analysis as follows to see how much the outlying observations affect your results.
- Run ANOVA on the entire data.
- Remove outlier(s) and rerun the ANOVA.
- If the results are the same, then you can report the analysis on the full data and report that the outliers did not influence the results.
- If the results are different, try running a non-parametric test (e.g. Kruskal-Wallis) or simply report your analysis with and without the outlier.
Two other approaches for dealing with outliers are to use trimmed means or Winsorized samples (as described in Outliers and Robustness) or to use a transformation. In particular, a reciprocal transformation f(x) = 1/x can be useful.
For example, if in measuring response times for a rat in a maze, suppose the following times were recorded:
20, 21, 24, 26, 30, 31, 33, 95, 230
It is quite possible that two of the rats simply got bored or got distracted, and so the results are quite distorted. In this case, the use of a reciprocal transformation tends to reduce the effect of long times. Effectively, you are transforming time into speed. The transformed data are:
.0500, .0476, .0417, .0385, .0333, .0323, .0303, .0105, .0043
Links
Examples Workbook
Click here to download the Excel workbook with the examples described on this webpage.
References
Halldestam, M. (2016) ANOVA – the effect of outliers
http://www.diva-portal.se/smash/get/diva2:935253/FULLTEXT01.pdf
Howell, D. C. (2010) Statistical methods for psychology (7th ed.). Wadsworth, Cengage Learning.
https://labs.la.utexas.edu/gilden/files/2016/05/Statistics-Text.pdf
I should be grateful if someone could provide an explanation to the following situation:
The outcome of a statistical analysis of a bioequivalence study ( 2 arms of generic product-population 38) is for me a difficult to understand
one subject, in one arm of the study, showed a very limited absorption of the tested drug. the statistical analysis showed by including the data of that one individual/one arm, bioequivalence failed with very wide Confidence Interval
By removing the data of that one individual, Confidence Interval value has narrowed significantly and test/reference products showed bioequivalnce
Is that possible? data from 1/38, one leg, alters dramatically the value of CI?
I should be grateful for any assistance
Yours
Riad Ayech
ayechc@aol.com
Hello Riad,
Theoretically, this is possible. Outliers can distort the analysis. Whether this is true in the case that you are referring to, I can’t comment on since I am unfamiliar with the details.
Charles
Thanks Charles;
It is unusual situation whereas the results of one volunteer/ only one leg of the study out of 40 changed the value of CI from success to failure ,
1- Extremely wide range of mean values for both Cmax and AUC.
Test Reference
Cmax
Thanks Charles
As you see from the summary of the results below, the measurements of one volunteer/one leg out of 40 volunteers have distorted the value of CI from success to failure. You will see how the range was wide for the two concerned parameters. Is there any statistical way to deal with this situation? Best Regards Riad
Cmax ( range) : 0.658-129.3 11.9-105.7
AUC (range): 1.29-1901.7 314.2-1807.2
– As a result, an extremely wide values of the calculated ratio (Test/reference) were calculated
• Cmax: 3.43-145.8
• AUC: 0.36-147.0
Thanks Charles
Riad,
Assuming all the calculations are correct, you shouldn’t try to change the results of the analysis. They are what they are.
If one specific observation is a suspected outlier, you might want to understand the nature of this observation. Do you suspect that it is truly an unusual event and so is distorting the analysis? (e.g. perhaps the measurement was done poorly or there was something non-random about the observation). If so, then you might consider reporting the results with and without this observation.
Charles
Hi Charles,
How did you calculate the residual values in this example?
Thank you,
Jonathan,
E.g. cell B21 contains the formula =(B4-B$12)/$F$16.
Charles
Hi Charles
First my objective is :
* take data without outlier and analyze the data
* put outlier in the data (one on each operator and one on all)
*analyze the data with outlier
*identify outlier in the data and handle the outlier
* find a best method that is identify and handle the outliers
* my data contains 30 measurements (3 operators 5 parts 2 replications)
My question is :is there any method can identify and handle outlier in Nested ANOVA
The webpage you mentioned above is not appeared
Thanks
Mohammed,
I can’t think of any reasons why dealing with outliers is different for nested ANOVA.
Which webpage does not appear?
Charles
All pages not appeared
Mohammed,
I don’t know why the pages don’t appear. They appear on my computer. If necessary you need to copy each link manually into your browser.
Charles
Dear Charles
Can you send the webpages by email
Thanks
meysm27@gmail.com
Mohammed,
I don’t know why you can’t access the webpages via your browser. They are clearly accessible and so I don’t want to find myself sending out emails with this information.
Charles
More informative
Hi
I have a Nested design it is for Gage R&R
How can I detect outliers in this Nested design which is based on ANOVA .Is it the same way that you mentioned above or there are different way and what software could help me to detect outliers in Nested Gage R&R and which ways can deal with this outliers?